
Ads analysis is just this: figuring out what changed in your ads performance across campaigns, creatives, audiences, placements, and channels, why it changed, and what you should do next.
Ads analysis (often searched as ad analysis) is a structured way to diagnose performance changes across paid media.
That sounds simple until you’re living it.
One day your “winner” campaign prints purchases. The next day CPA jumps 30%, ROAS slides, and nothing obvious changed. You open Meta Ads Manager, Google Ads, TikTok, GA4, Shopify. You see numbers everywhere, but no one is telling you the reason.
Why did this campaign suddenly stop converting?
What changed this week?
Is it creative fatigue, audience saturation, a placement shift, or the site?
This guide is built to make ads analysis feel less like guesswork and more like a repeatable process.
What we’ll cover:
A simple definition of ads analysis for paid media teams
Why it matters (in ways you actually feel in the account)
A practical workflow to diagnose drops and spikes
The key metrics and what they really indicate
Manual ads analysis vs AI ads analysis (where each wins)
A realistic walkthrough: ROAS drops 20%, what do you do?
The best types of ads analysis tools to use in 2025/2026 (and what to avoid)
FAQs at the end
Quick scope note: this is about paid digital channels (Meta, Google, TikTok). Not “traditional” advertising analysis.

AI Agent for Paid Teams
Ask question in plain english Get insights across all platforms
Trusted by 1000+ marketing teams across 80+countries


What Is Ads Analysis?
Ads analysis is a structured way to diagnose performance changes across multiple ads, campaigns, and channels tracking how spend turns into clicks, conversions, and revenue.
That’s the whole game. You’re tracing the chain to see where the leak started.
In practice, ads analysis can happen at different levels:
Channel: Meta vs Google vs TikTok
Campaign / ad set / ad level: what specifically shifted inside the account
Creative: static, carousel, UGC, video ad performance
Audience: prospecting vs retargeting, broad vs interests, overlap issues
Placement & device: Reels vs Feed, iOS vs Android, mobile vs desktop
Message, offer, landing page: post-click conversion drivers
The output of good ads analysis is not “performance declined.”
It’s:
A specific cause (or a small set of likely causes, ranked)
A specific next action (what you’ll change, test, or monitor next)
The biggest misconception: reporting is not analysis.
Dashboards tell you what happened. Ads analysis explains why it happened and what to do about it.
AI Agent for Paid Teams
Ask question in plain english Get insights across all platforms
Trusted by 1000+ marketing teams across 80+countries
Why Ads Analysis Matters
If you run paid media long enough, you learn this: performance doesn’t “slowly drift.” It often snaps.
Ads analysis matters because it helps you catch problems early and fix the right thing.
Prevent wasted spend
If CPA is climbing and you don’t know why, the default move is usually “turn stuff off.” Sometimes that’s right. Sometimes you just killed your best future performer because you didn’t see the real driver.
Example: Frequency spikes in a prospecting ad set and CPA rises. That’s often saturation, not “bad creative.”
Improve ROAS by reallocating budget to what actually drives conversions
Clicks can lie. Cheap CPC can lie. Even platform-reported ROAS can mislead if attribution windows or channel mix changed.
Example: Google non-brand starts taking more spend while brand shrinks. ROAS drops, but the account might still be healthy. You need the split to know.
Spot creative fatigue early
A common trap: CTR stays stable, but conversions drop. That’s usually fatigue, audience quality shift, or post-click friction.
Example: CTR flat, CVR down, CPA up. The ad is still getting attention, but fewer people are buying.
Explain results to stakeholders without hand-waving
Founders and clients don’t want “the algorithm is weird.” They want a narrative.
What changed?
Where did it change?
Why do we believe that’s the driver?
What are we doing this week?
Ads analysis turns messy data into a clear story.
AI Agent for Paid Teams
Ask question in plain english Get insights across all platforms
Trusted by 1000+ marketing teams across 80+countries
How Ads Analysis Works
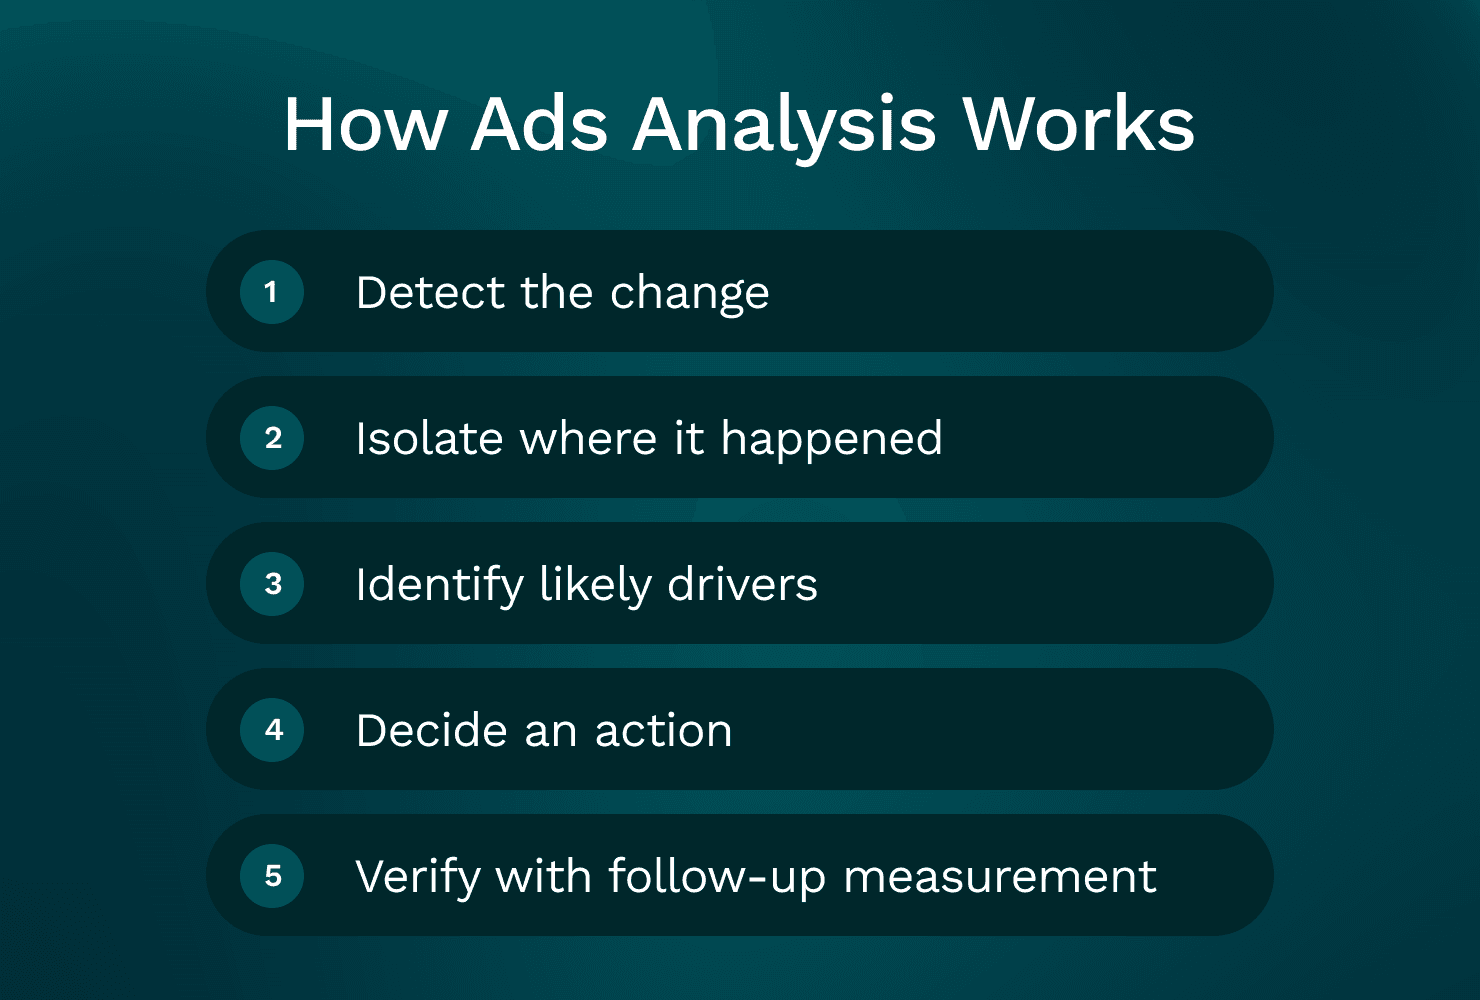
A simple way to think about it is a 5-step workflow:
Detect the change (what moved?)
Isolate where it happened (channel, campaign, creative, audience, placement)
Identify likely drivers (rank hypotheses with evidence)
Decide an action (change, test, or hold)
Verify with follow-up measurement (did the action work?)
Analysis changes depending on the slice you’re looking at:
Channel (Meta vs Google vs TikTok)
Creative (what concept is resonating?)
Audience (prospecting vs retargeting behavior)
Placement/device (delivery mix shifts)
Post-click (landing page and offer health)
And it’s always built around real marketer questions:
“Why did ROAS drop week over week?”
“Why did CPA spike yesterday?”
“Which creative actually drove purchases, not just clicks?”
“Did anything change in placements or devices?”
“Is this an ad problem or a site problem?”
One rule that prevents a lot of bad decisions: compare like-for-like.
Before you declare a “drop,” make sure you’re not mixing:
Different attribution windows
Different date ranges (weekend vs weekday mix matters)
Different objectives (Purchase vs Add to Cart)
Different geos/devices
Different spend levels (small spend swings look dramatic)
1) Start with the change: What exactly moved?
Pick your headline KPI (usually ROAS or CPA) and quantify it.
“ROAS is down 20% week over week.”
“CPA is up from $42 to $58 (+38%).”
“Spend is flat, purchases down 18%.”
Then ask: is this a volume problem or an efficiency problem?
Volume-driven: spend down, impressions down, fewer conversions
Efficiency-driven: spend flat or up, but conversion rate or AOV got worse
Before you dig into creative and audiences, confirm basics. Most teams miss this because it feels “too simple”:
Tracking and measurement checks (do these first):
Pixel/SDK still firing? Any sudden event drop?
GA4 session volume stable?
Shopify orders stable vs platform-reported purchases?
Attribution settings changed?
Budget caps hit (limited by budget)?
Campaigns reset into learning (big edits, new creatives, big budget jumps)?
Any UTM changes breaking reporting?
If tracking is broken, everything downstream is noise.
2) Break it down by channel (Meta vs Google vs TikTok)
Channel-level ads analysis is where you find the “big rocks.” Even if you’re a Meta-heavy spender, you want to know whether the issue is isolated or systemic.
Meta (Facebook/Instagram)
Here’s what usually causes performance shifts on Meta:
Creative fatigue (frequency rises, CVR falls)
Audience saturation (broad starts behaving like retargeting)
Placement mix changes (Reels delivery increases, results change)
CPM volatility (auction pressure, seasonality, competitor activity)
A practical Meta check: is CPA up because CPM rose, or because CVR fell?
CPM up, CTR flat: the auction got more expensive
CTR down, CPM up: likely relevance/fatigue
CTR flat, CVR down: often post-click or intent quality shift
You’ll also hear people search for a “meta ads analyzer” or “facebook ad analyzer.” What they usually mean is: “tell me what changed inside Meta that I’m not seeing.”
Google Ads
Google analysis is different because intent is different.
Common drivers:
Query mix shifts (more broad queries, less high intent)
Match type changes (or broad match expanding)
Negative keyword gaps
Brand vs non-brand split changing
Landing page alignment (ad promise vs page content)
A quick Google check: split performance by brand vs non-brand and by search terms. Many “ROAS drops” are really “non-brand scaled faster than brand,” which is not automatically bad, but it changes blended efficiency.
TikTok Ads
TikTok tends to move with creative faster than anything else.
Common drivers:
Hook performance (first 1–2 seconds)
Creative fatigue cycles (winners burn out quickly)
Iteration cadence (you stopped shipping new variations)
Audience + creative pairing (some angles only work in prospecting)
You won’t always have clean “thumb-stopping rate” in the way you want, so you use proxies like:
2-second video views
hold rate / average watch time
click and conversion trends by creative
Avoid false comparisons across channels. A ROAS gap between Meta and Google doesn’t automatically mean “move budget.” You’re comparing different intent and attribution behavior.
3) Break it down by creative (static, carousel, UGC, video)
Creative analysis is where most accounts are won or lost in 2026.
Don’t stop at CTR.
At minimum, analyse ads by creative using:
CTR (attention / relevance)
CVR (conversion rate)
CPA
ROAS
Post-click signals (bounce rate, time on site, add-to-cart rate if you can see it)
For video ads analysis specifically, look at:
The first 2 seconds: does it earn the next second?
Message clarity: can someone understand the offer with sound off?
Offer visibility: do they see price, outcome, or proof quickly?
Hook/body/CTA variation: are you testing hooks or just changing captions?
“Creative is the targeting” is real on Meta and TikTok.
What that means for ads analysis frequency:
If you’re spending meaningful budget, you should review creative performance at least weekly.
If you’re scaling, you review it more often because fatigue arrives faster.
A practical approach that makes insights more reusable: group creatives by concept angle, not by file name.
Examples:
Pain point angle (problem-led)
Testimonial angle (UGC proof)
Demo angle (show the product in use)
Offer angle (discount, bundle, free shipping)
Founder story angle
When performance drops, you can answer: “Which angle is losing steam?” That’s more useful than “Ad 14 stopped working.”
This is also where many teams look for an “ads analyzer” that can break down results by creative concept, not just by ad ID.
4) Break it down by audience (prospecting vs retargeting, broad vs stacked interests)
Audience analysis is about knowing who you’re buying and how that pool is behaving.
Start with the big split:
Prospecting (cold)
Retargeting (warm)
Then look at your major audience types:
Broad
Interests (stacked or single)
Lookalikes (if you still use them)
Customer lists
Engagers / site visitors / view content retargeting
What you’re watching for:
Overlap and cannibalization: are multiple ad sets chasing the same people?
Saturation signals: frequency up, CPM up, CVR down
Retargeting volatility: small pools swing hard day to day
A common mistake: reading too much into retargeting on short windows.
If your retargeting pool is small, analyse it on a longer window (14–30 days), then look at daily trends mainly for anomalies.
Decisions should map to what you found:
Saturation: expand audience, widen geo, broaden targeting, refresh creative
Retargeting swings: consolidate, adjust exclusions, focus on creative sequencing
Quality shift: change optimization event, tighten landing page match, refine offer
5) Break it down by placement and device
Placements can quietly change your results even when nothing else changed.
Meta’s auto placements are great until the delivery mix shifts.
Common scenario: Reels starts taking more impression share because it’s cheaper inventory. If your creative isn’t built for Reels, your CTR might look fine, but CVR tanks because the click quality changed.
Checks that catch this fast:
Placement-level CPA/ROAS outliers
Placement mix week over week (where did spend move?)
Creative formatting by placement (9:16 vs 1:1, captions, safe zones)
Device split also matters more than most teams admit:
iOS vs Android tracking differences
Mobile vs desktop landing page performance differences
Checkout friction differences (especially for Shopify)
Decisions you can make from placement/device analysis:
Exclude consistently poor placements (carefully, with enough data)
Build placement-specific creative (Reels-native, Stories-native)
Split ad sets by placement for control (when spend supports it)
Adjust bid/budget allocation if one device is doing the heavy lifting
6) Break it down by message, offer, and landing page
Most “ad problems” are actually post-click problems.
The simplest tell:
CTR stable but CVR drops usually points to landing page, offer, or intent mismatch.
Here’s what usually causes this:
Offer changed (price, discount, bundle)
Shipping or delivery terms changed
Stock issues (best sellers out of stock)
Page speed got worse
A popup or form added friction
Checkout bugs (Shopify updates, payment method issues)
Use GA4 and Shopify to validate:
Bounce rate shifts
Add-to-cart rate changes
Checkout initiated vs purchase drop-off changes
Revenue per session changes
What to test first (if you need a priority order):
Clarity above the fold: headline, product promise, primary CTA
Proof: reviews, UGC, before/after, guarantees
Pricing and shipping clarity: no surprises
Checkout friction: reduce steps, improve payment options, fix errors
Speed: especially on mobile
This is why cross-channel ads analysis gets hard manually. Your ad platforms don’t know what happened on Shopify. GA4 doesn’t know which Meta creative was shown. You end up stitching the story together.
AI Agent for Paid Teams
Ask question in plain english Get insights across all platforms
Trusted by 1000+ marketing teams across 80+countries
Key Metrics to Track in Ads Analysis
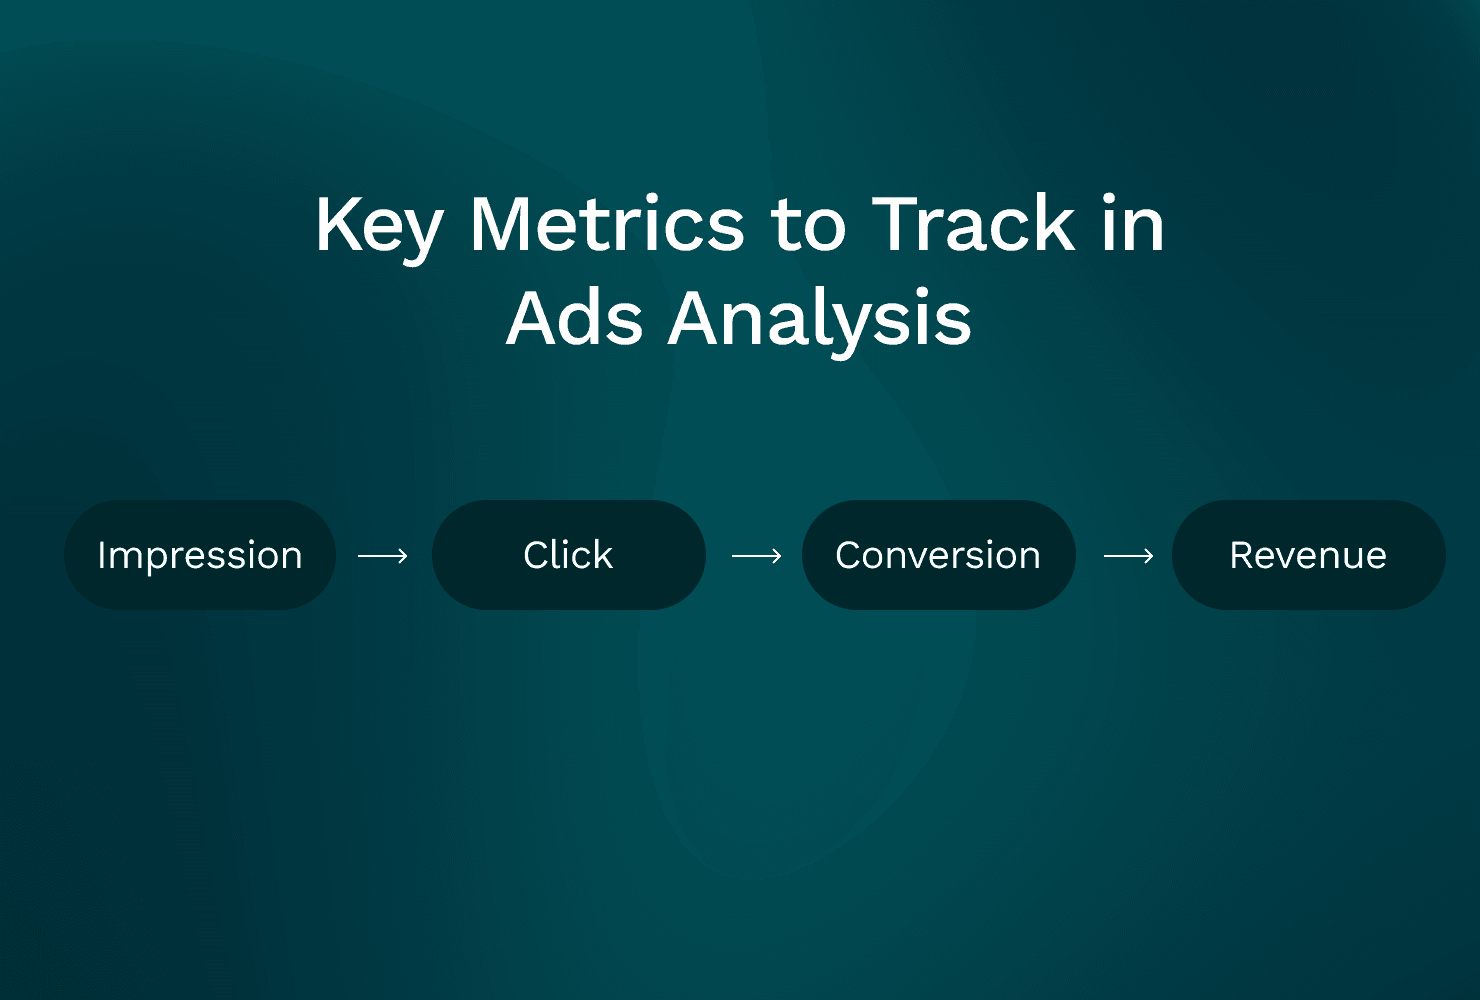
Metrics are clues. The trick is reading them as a chain:
Impression → Click → Conversion → Revenue
And always pairing metrics so you don’t get fooled by one number.
Suggested review cadence by team maturity:
Daily: spend, CPA/ROAS anomalies (especially on high budgets)
Weekly: creative patterns, audience saturation, placement shifts
Monthly: channel mix, offer strategy, landing page conversion work
One more rule: CTR alone is misleading. ROAS alone hides volume. Pair them.
CTR (Click-Through Rate)
What it tells you: creative/message relevance and thumb-stopping power.
How often to review: 2–3x/week for high-spend campaigns; weekly otherwise.
Common mistakes:
Optimizing for CTR and lowering conversion quality
Comparing CTR across placements without context (Reels vs Feed will behave differently)
Quick diagnostic: CTR down + CPM up often signals fatigue or weaker relevance.
CPC (Cost Per Click)
What it tells you: your cost to earn attention. Influenced by CPM and CTR.
How often to review: weekly (daily if spend is high and volatile).
Common mistakes:
Treating CPC like success
Ignoring that higher CPC can still win if CVR and AOV improve
Quick diagnostic: CPC up while CTR flat often means CPM increased (auction pressure).
CPA (Cost Per Acquisition / Purchase)
What it tells you: efficiency of the entire funnel from impression to conversion.
How often to review: daily for big budgets; otherwise 2–3x/week.
Common mistakes:
Making decisions on too little data (small conversion counts)
Not segmenting CPA by creative and audience
Panicking during learning phase volatility
Quick diagnostic: CTR stable but CPA up usually means CVR down (landing page, offer, or intent shift).
ROAS (Return on Ad Spend)
What it tells you: revenue efficiency. Best paired with spend and contribution margin.
How often to review: weekly for direction; daily only when volume is high and tracking is stable.
Common mistakes:
Ignoring delayed conversions
Blending channels with different attribution behavior
Mixing attribution settings across comparisons
Quick diagnostic: ROAS down + CPA up + AOV flat usually means conversion efficiency dropped. Your job is to find where (creative, audience, placement, site).
AI Agent for Paid Teams
Ask question in plain english Get insights across all platforms
Trusted by 1000+ marketing teams across 80+countries
Manual Ads Analysis vs AI Ads Analysis
Manual ads analysis is possible. Most of us learned that way.
The issue is time. When you’re busy launching creatives, building landing pages, answering Slack, and managing budgets, analysis becomes “quick checks” instead of real diagnosis.
That’s where AI-based ads analysis can help, as long as you keep expectations realistic:
AI is good at detecting changes, surfacing drivers, and summarizing patterns
It still needs a marketer to make judgment calls on creative direction, offer strategy, and what’s actually feasible this week
If you’re searching things like ai ads analyzer, ai ad analyzer, or ai ads analyzer free, you’re usually looking for speed. You want answers without exporting five CSVs.
AI Agent for Paid Teams
Ask question in plain english Get insights across all platforms
Trusted by 1000+ marketing teams across 80+countries
Comparison table: Manual vs AI ads analysis
Area | Manual ads analysis | AI ads analysis |
|---|---|---|
Data collection | Export from Meta/Google/TikTok, pull GA4/Shopify separately | Connectors pull multi-source data automatically |
Segmentation | Pivot tables, filters, screenshots, naming conventions | Breakdowns by channel/campaign/ad/creative/audience/placement with consistent views |
Root-cause analysis | Depends on analyst skill, easy to miss a driver | Flags anomalies and likely drivers (then you verify) |
Speed to insight | Slow, especially cross-channel | Fast, designed for “what changed?” questions |
Consistency | Varies by person and week | Repeatable weekly and daily checks |
Collaboration/shareability | Decks, Looms, screenshots, spreadsheets | Shareable summaries, links back to underlying metrics (tool-dependent) |
Risk of missed drivers | High when time is limited | Lower, but depends on transparency and data quality |
Where manual analysis still wins
Manual wins when the job is qualitative:
Reviewing creative quality and hooks
Understanding brand context and customer objections
Knowing operational changes (stock, shipping, pricing, promos)
Interpreting “why” with market awareness
Manual breaks when the job is repetitive and cross-channel:
Joining Meta + GA4 + Shopify every week
Catching subtle shifts early (placement mix, audience overlap)
Producing consistent reporting across many accounts (agency reality)
Doing deep dives without losing half a day
Where AI helps most
AI helps most when the question is:
“What changed week over week?”
“Why did CPA spike yesterday?”
“Which creative/audience combo drove the lift?”
“Did Reels suddenly take more budget?”
“Is the drop coming from ads or post-click?”
It works best when it can connect multiple sources:
Meta Ads
Google Ads
TikTok Ads
GA4
Shopify
Outputs worth looking for in an AI ad analyzer:
Driver decomposition (what contributed most to the change)
Anomaly detection (what’s unusual vs baseline)
Plain-English summaries you can share
Prioritized next actions (with the underlying data visible)
AI Agent for Paid Teams
Ask question in plain english Get insights across all platforms
Trusted by 1000+ marketing teams across 80+countries
Ads Analysis Example
Let’s run a realistic scenario.
Timeframe: last 7 days vs previous 7 days
Spend: flat
ROAS: down 20%
AOV: flat
Step 1: Confirm tracking and attribution didn’t change
Meta attribution settings unchanged
No major GA4 tracking drop
Shopify orders stable relative to traffic
No site outage
So this looks like a real performance change, not a measurement issue.
Step 2: Find where the drop happened
Meta ROAS down 25%
Google ROAS flat
TikTok small spend, noisy
This is primarily a Meta issue.
Step 3: Check the funnel chain on Meta
CPM slightly up (+8%)
CTR stable
CVR down (that’s the big change)
CPA up (expected if CVR drops)
CTR stable but CVR down tells you the ad is still getting clicks, but the clicks are converting worse.
Now we slice.
Step 4: Placement view shows the real shift
You break out Meta results by placement.
You notice:
Reels share of spend increased significantly week over week
Reels CPA is much higher than Feed/Stories
The top spend videos were originally built for Feed (cropping issues in 9:16, captions missing, key text in unsafe zones)
Nothing “mystical” happened. Delivery moved into a placement your creative wasn’t built for, and conversion efficiency dropped.
Step 5: Action plan
Create Reels-native versions of the top 3 videos
9:16 export, safe-zone text, burned-in captions
Rotate 3 new hooks (keep the body similar, change the first 2 seconds)
Reduce saturation pressure
Expand audience slightly (broader targeting or geo expansion) to manage frequency
Temporary budget shift
Move 15% of Meta budget to the best-performing Google ad group for stability while Meta creative refresh rolls out
Step 6: Validation plan
Over the next 3–5 days, you’re watching for:
Reels CVR to recover (or at least stop dragging blended)
CPA to normalize as conversion efficiency improves
ROAS to rebound toward baseline
Placement mix to stabilize, or performance to hold even if Reels stays high because the creative fits
That’s ads analysis: not just seeing ROAS down, but knowing what changed and what you’re doing next.
AI Agent for Paid Teams
Ask question in plain english Get insights across all platforms
Trusted by 1000+ marketing teams across 80+countries
Ads Analysis Tools (2025): what to use and what to avoid
Most people searching for an ads analysis tool are not looking for another dashboard.
They’re looking for something that explains performance.
An ads analysis tool should help answer:
What changed?
Where did it change?
Why did it change?
What should I do next?
Why dashboards alone aren’t enough
Platform dashboards are great at slicing data inside one platform.
But real ads analysis usually needs context across:
Meta / Google / TikTok (what changed in spend and efficiency?)
GA4 (did user behavior change?)
Shopify (did checkout conversion change?)
Creative and placement details (what actually drove the shift?)
A dashboard shows you a chart. It doesn’t connect drivers across dimensions and hand you a clean narrative.
So when someone searches “ad analyzer” or “ads analyzer,” they often mean “help me diagnose,” not “help me visualize.”
Categories of tools
1. Platform-native reporting
Meta Ads Manager
Google Ads
TikTok Ads Manager
2. Analytics / commerce sources
GA4
Shopify (or your ecommerce platform)
3. True ads analysis tools
Cross-channel + insight-focused
Often includes AI for anomaly detection and driver explanations
If you’re looking at ads analysis tools for 2025/2026, selection criteria that actually matter:
Multi-source connectors (Meta, Google, TikTok, GA4, Shopify)
Creative-level breakdowns (including video ad performance)
Audience and placement cuts
Anomaly detection (what changed since last week?)
Plain-English insights you can verify
Export/share workflows for teams and clients
What a good ads analysis tool should do (checklist)
Use this as your evaluation checklist:
Answers “what changed?” automatically
Week-over-week and month-over-month deltas on core KPIs
Pinpoints “where it changed”
Channel → campaign → ad set → ad → creative
Explains “why it changed” with evidence
Fatigue signals, saturation, placement shifts, CPM pressure, CVR drops
Recommends “what to do next”
Prioritized actions (creative refresh, budget shifts, landing page tests)
Supports collaboration
Shareable summaries, notes, and links back to source data
This is what people usually mean when they say “we need an ads analysis tool,” even if they phrase it as “analyse ads faster.”
Why Meta/Google dashboards are reporting tools
They’re excellent for platform-specific questions:
Which ad set spent the most?
Which keyword has the highest CPA?
Which ad has the best CTR?
However, they’re not built for cross-channel causality:
Meta says purchases dropped. GA4 says bounce rate spiked. Shopify shows checkout drop-offs. Who ties that together?
These dashboards also don’t translate patterns into decisions. You still have to interpret.
A common gap is seeing creative + placement + post-click data in one narrative you can share.
AI-based ad analyzers: what to look for
AI-based tools can be useful, especially for day-to-day diagnosis.
What to look for:
Clear drivers (not vague “performance changed” statements)
Ability to drill down (prove it with underlying metrics)
Consistent time comparisons (same window, same attribution assumptions)
Evidence-based recommendations (not generic advice)
Red flags:
Vague suggestions like “optimize your targeting” with no detail
No way to verify claims
Black-box “scores” with no context
Insights that ignore post-click data entirely
A note on “ai ads analyzer free”: free trials are useful to validate connectors and insight quality. Just don’t expect full multi-source depth for free forever.
GoMarble: An AI Ads Analysis Tool for Paid Teams
GoMarble is an example of an AI marketing analyst for paid advertising teams. The point is to help answer daily performance questions without living in spreadsheets.
What it connects (and why it matters):
Meta Ads, Google Ads, TikTok Ads for channel, campaign, creative, audience, placement performance
GA4 and Shopify for post-click behavior and revenue outcomes
This matters because a lot of ad “problems” are really site or funnel problems, and you can’t see that if you only look inside ad platforms.
What it helps you answer:
What changed in performance?
Why did ROAS drop or spike?
Which creatives, audiences, or placements actually drove results?
What should be optimized next?
How teams typically use it:
Weekly account reviews (what changed WoW, where are the drivers?)
Daily anomaly checks (catch CPA spikes before you burn budget)
Creative performance readouts (which angles are working?)
Stakeholder summaries (plain-English narratives you can share)
If you’ve ever wanted a “meta ads analyzer” that also understands what happened in GA4 and Shopify, this is the type of workflow GoMarble is aiming for.
Analyze your ads faster
If you follow the steps in this guide, the bottleneck is rarely “knowing what to do.”
It’s time. Pulling data from multiple platforms. Rebuilding the same views every week. Trying to explain performance in plain English.
If you want a faster way to answer “what changed, why, and what next” across Meta, Google, TikTok, plus GA4 and Shopify, you can analyze your ads with GoMarble!
Soft suggestion: run it alongside your current workflow for a week. Use it for the questions you already ask. See if it saves you time and catches drivers you might miss when you’re busy.
What does ads analysis actually mean in performance marketing?
Ads analysis is the process of breaking down what’s happening inside your ads, including spend, clicks, conversions, creatives, and audiences, to understand what’s driving results and what’s wasting budget. It’s less about theory and more about knowing what to change next.
How is ads analysis different from just looking at dashboards?
What are the most important metrics to look at when analyzing ads?
How do you analyze ads that suddenly stop performing?
How do you analyze ad creatives, not just performance numbers?
What’s a simple framework to analyze ads without overthinking it?
How often should you be analyzing ad performance?
Can ads analysis help reduce wasted ad spend?
How do you know if poor performance is an ad problem or a landing page problem?
What tools are typically used for ads analysis today?
Can ads analysis be done manually without tools?
What does an ads analysis tool actually do?
What does AI ads analysis help with, and what doesn’t it replace?
Are free ads analysis tools good enough?
Is ads analysis something only large teams do?
Is ad analysis the same as ads analysis?
From research to results
Go Beyond just analysis - discover winning creatives, research what's working in your market, and make campaign changes directly from your insights