Each row is one live Meta carousel ad. Swipe sideways to see every card in order, with its headline, description and button. Filter by niche or by how many cards the ad runs.
Susona
Beauty
4 cards
What the cards do: Proof, then benefit: a press mention on card 1, then one benefit per card.
“For most people, Retinol is the first product that comes to mind when they think of advancing their skincare routine. While it may be effective, Retinol is known to cause flakiness, dryness, redness, and even hyperpigmentation for those…”

Card 1 of 4
As seen in Vogue 😍
Shop Now

Card 2 of 4
Science-Based Skincare 🍃
Shop Now
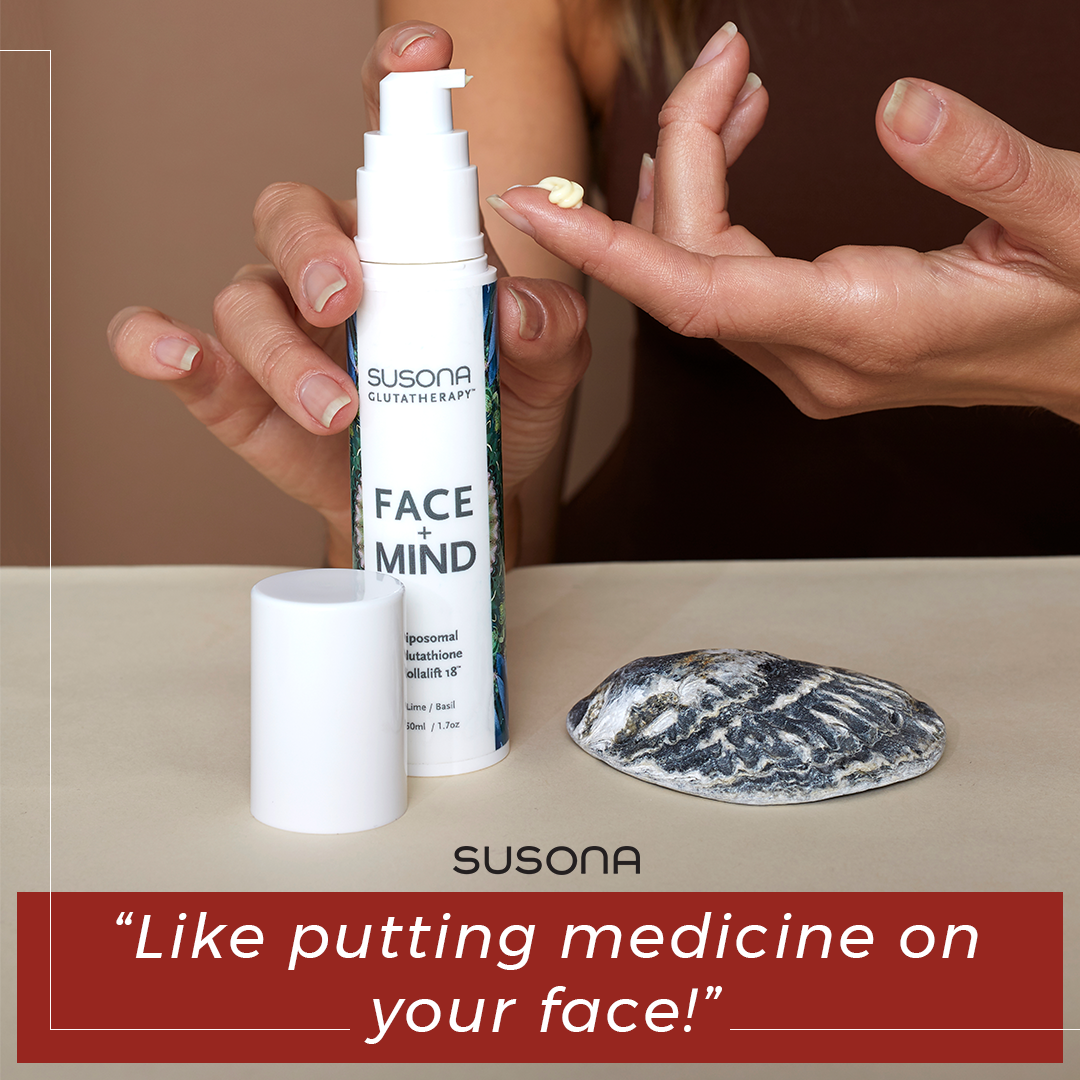
Card 3 of 4
Glutathione: Like Retinol, But Better 🍃
Shop Now

Card 4 of 4
Glow With Glutathione 💫
Shop Now
View in Meta Ad Library →
Medicube
Beauty
2 cards
What the cards do: Two products, one problem each: oil control, then pore size.
“[NEW SET on Sale!] Powerful Ingredients in Pore Care Duo help target Enlarged Pores, Excess Oil, and Lack of Hydration. <br /> Add to your routine & Get Poreless-looking skin.✨>> <a…”

Card 1 of 2
Control Oil & Stay Hydrated with Zero Pore One-Day Cream
Learn More

Card 2 of 2
Tighten Your Large Pores with Zero Pore One-Day Serum
Learn More
View in Meta Ad Library →
OOFOS UK
Fashion
6 cards
What the cards do: Product plus one spec per card, with the price on the last two.

Card 1 of 6
OOmega Sandal Nomad
New MEGA Midsole
Shop Now
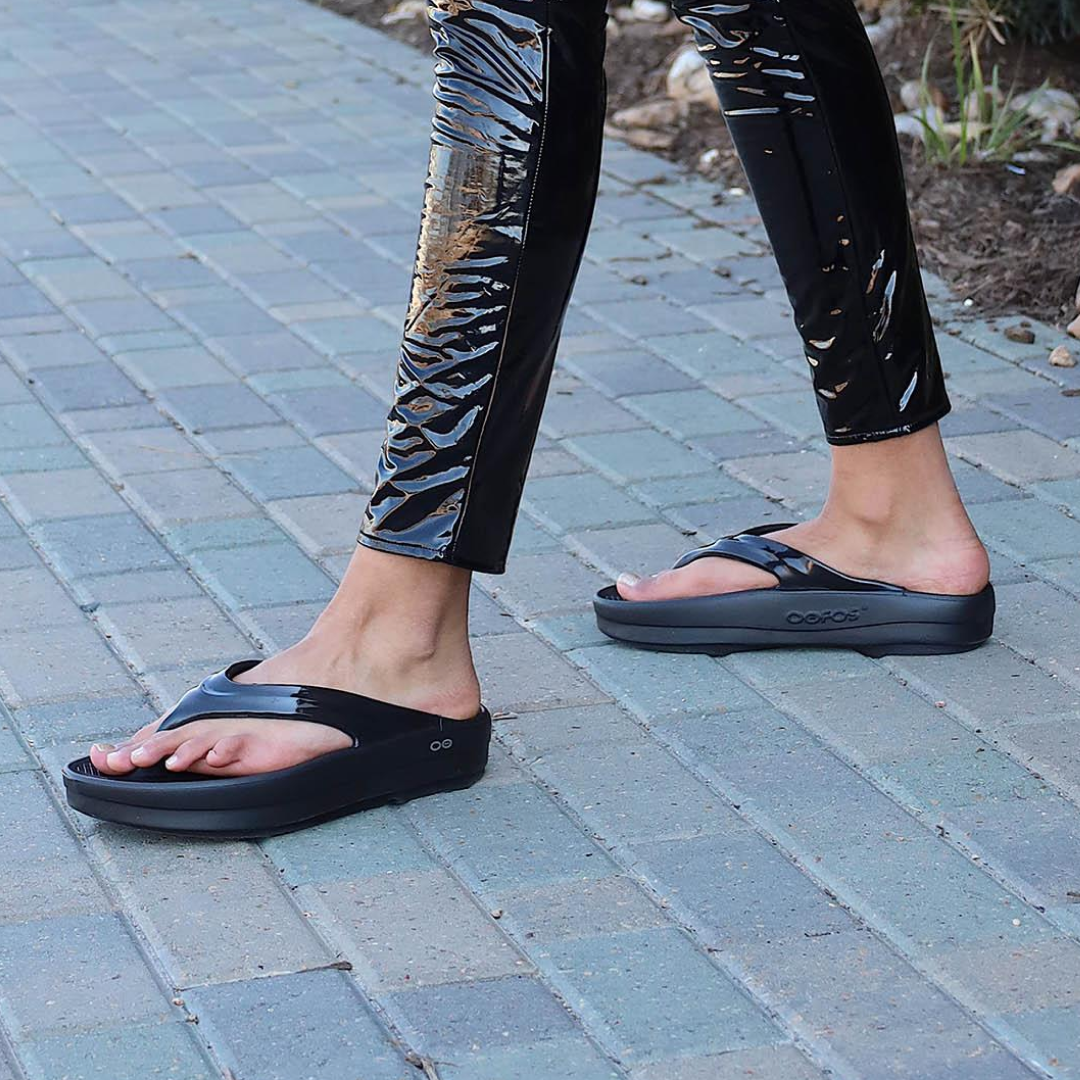
Card 2 of 6
OOmega Sandal Black
15mm more OOfoam™
Shop Now

Card 3 of 6
OOmega Sandal Nomad
42% more impact-absorption
Shop Now
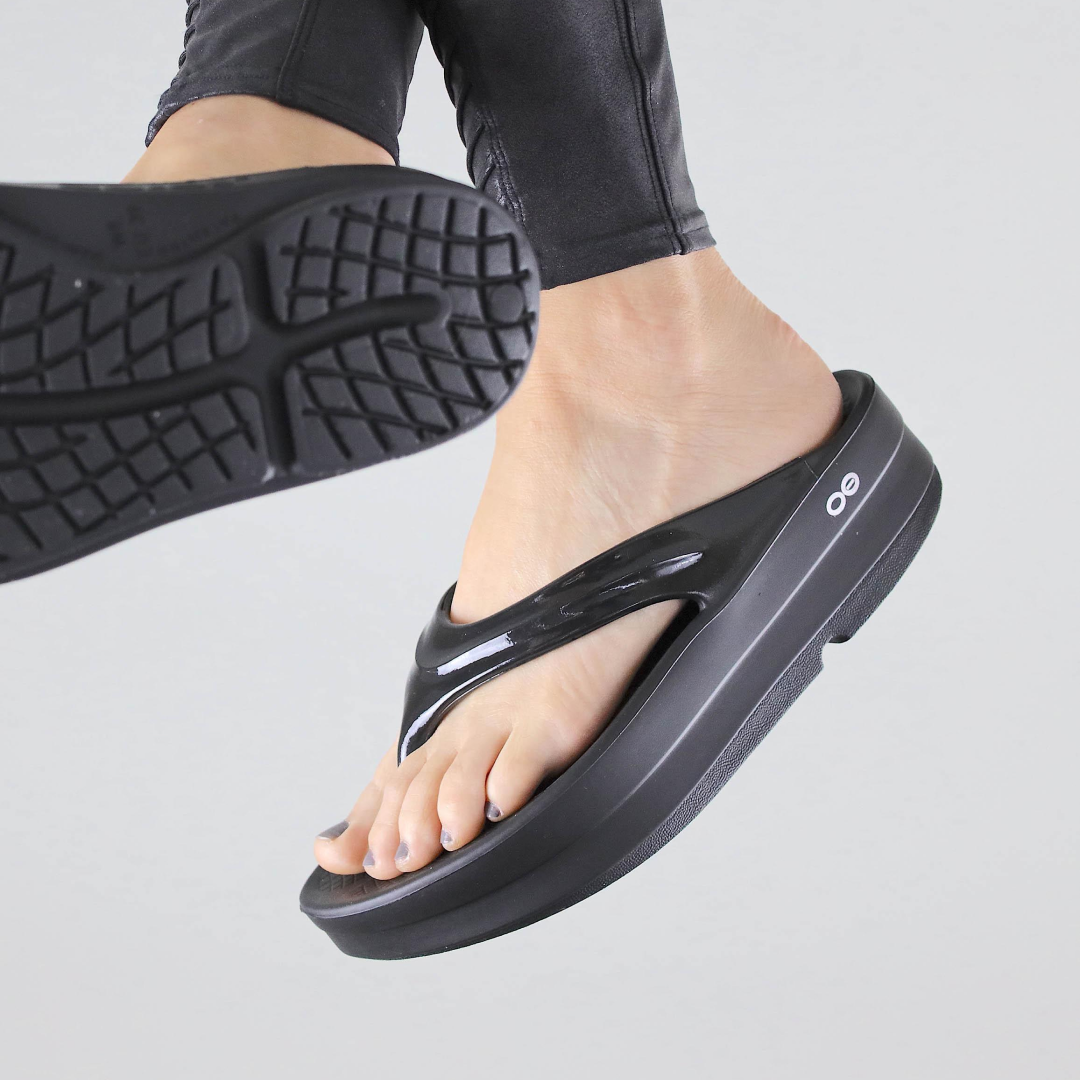
Card 4 of 6
OOmega Sandal Black
Feel the OO™
Shop Now
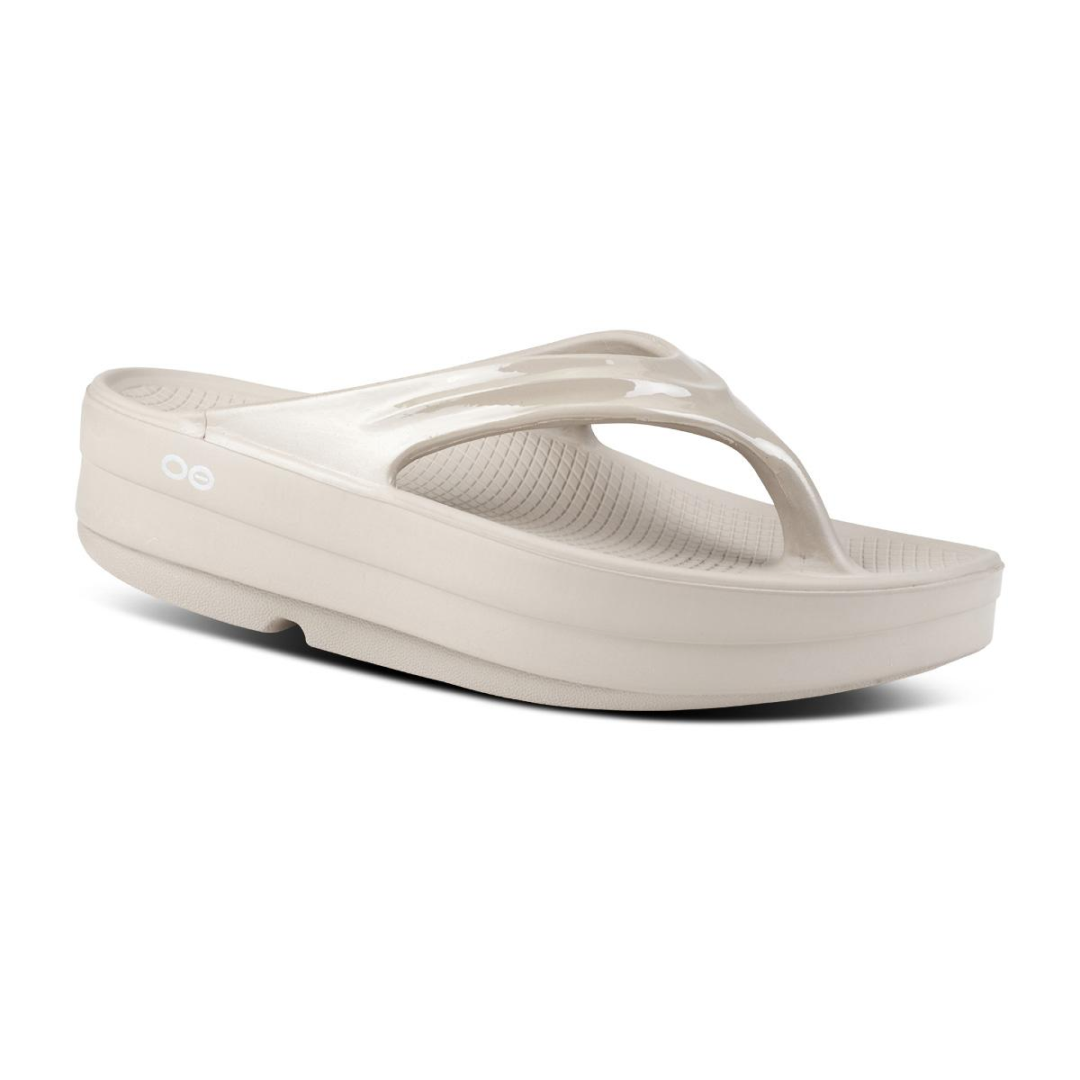
Card 5 of 6
OOmega Sandal Nomad
£75
Shop Now
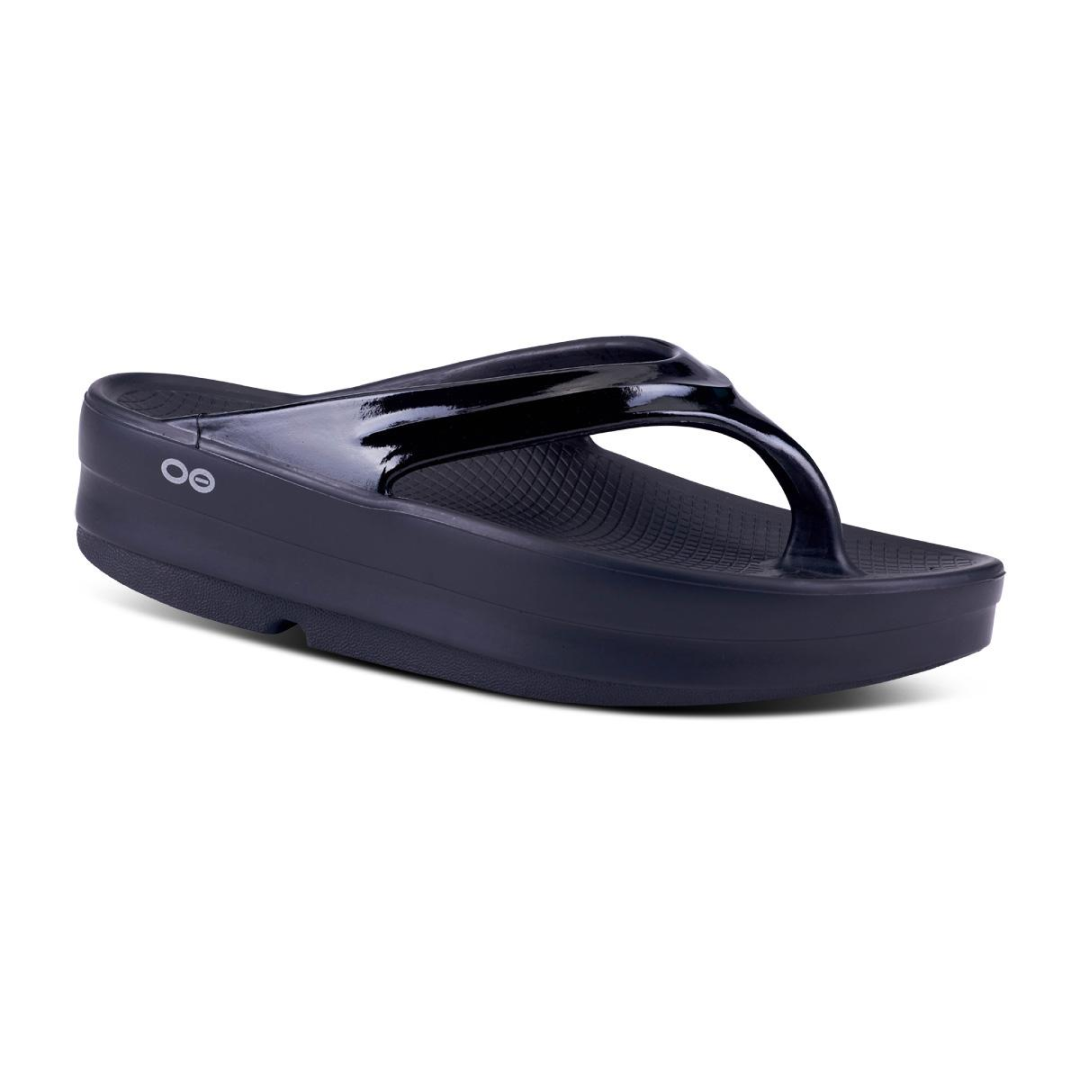
Card 6 of 6
OOmega Sandal Black
£75
Shop Now
View in Meta Ad Library →
Libas
Fashion
5 cards
What the cards do: Five cards under one repeated headline; the images carry the range.

Card 1 of 5
Introducing Indigo - Spring Summer 2022
Shop Now

Card 2 of 5
Introducing Indigo - Spring Summer 2022
Shop Now
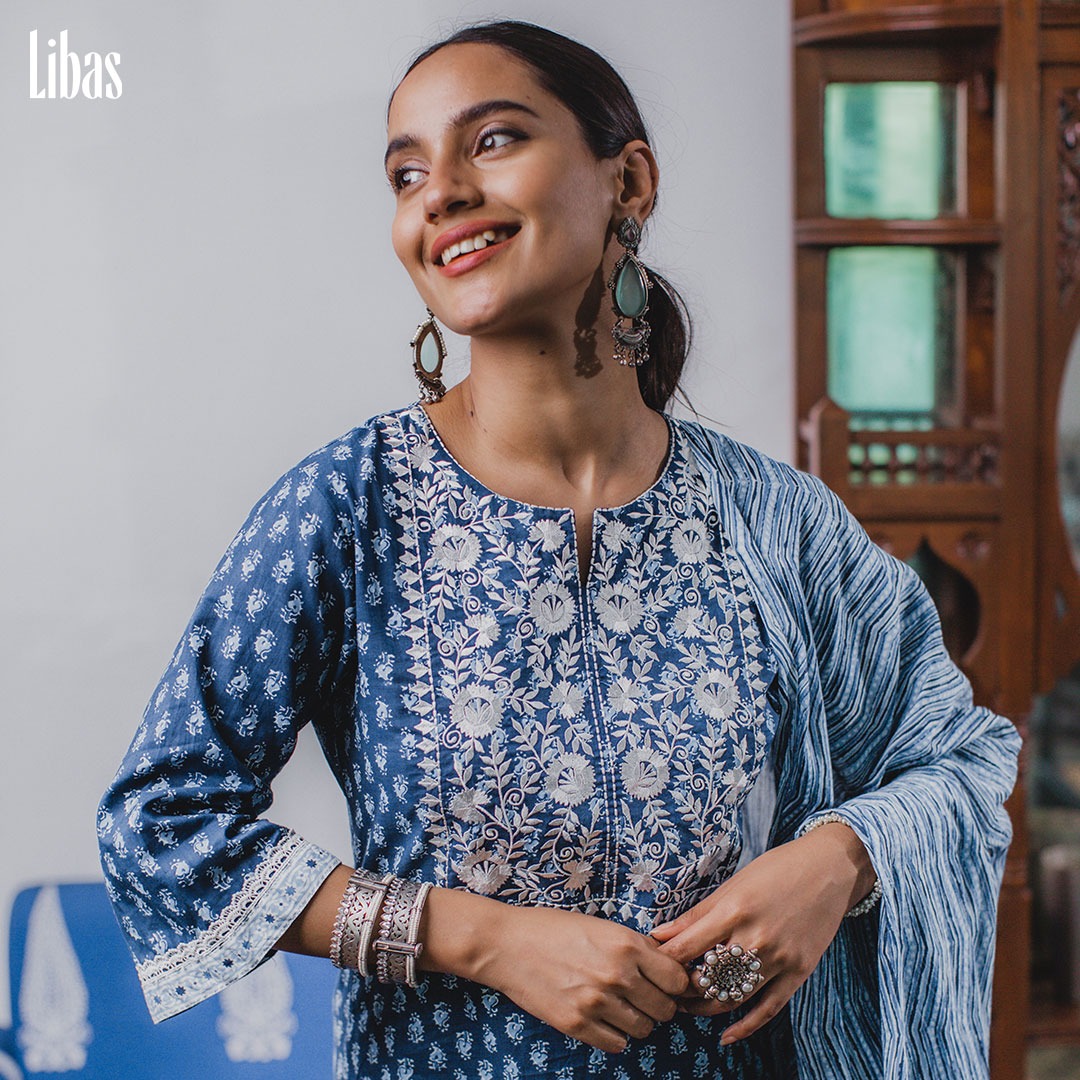
Card 3 of 5
Introducing Indigo - Spring Summer 2022
Shop Now
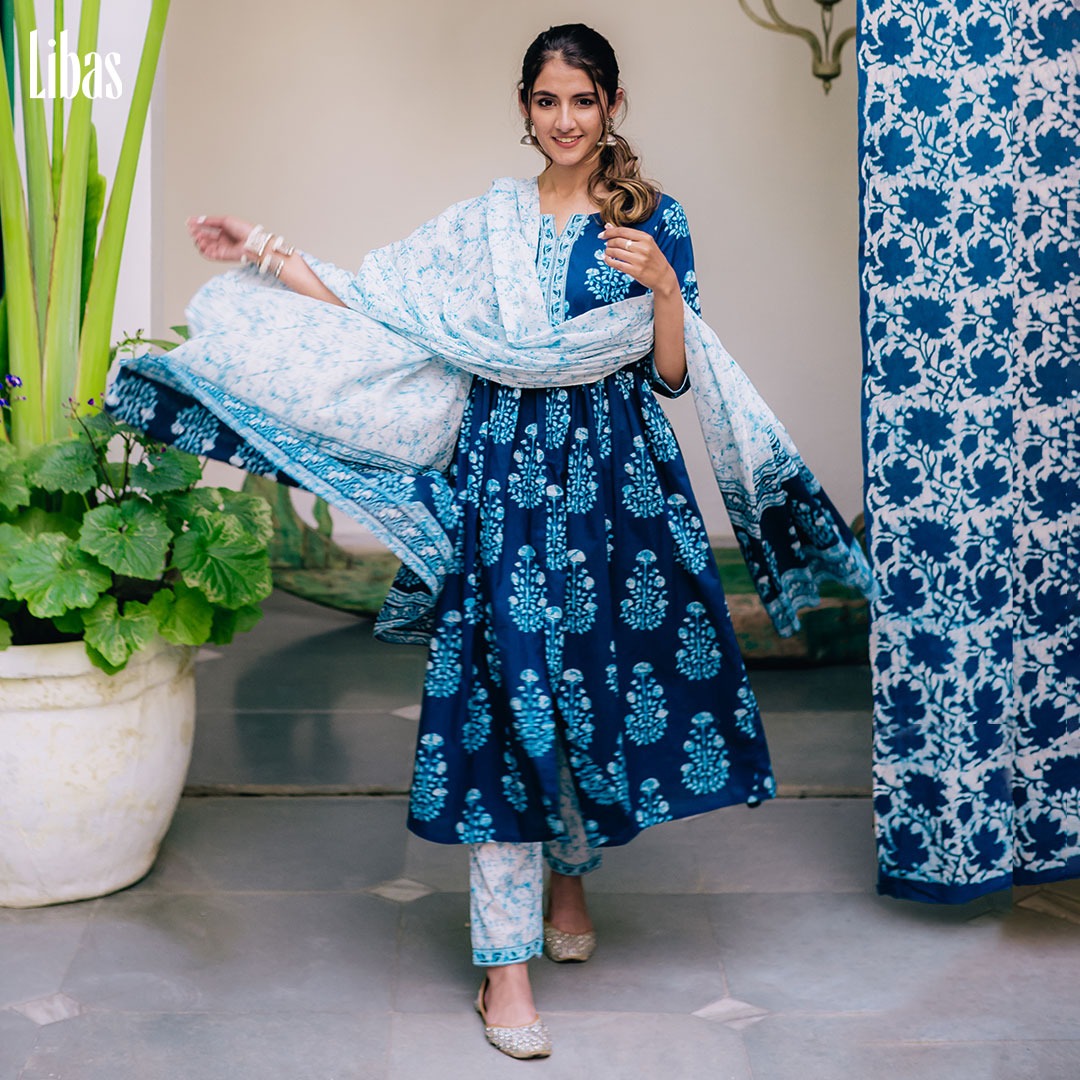
Card 4 of 5
Introducing Indigo - Spring Summer 2022
Shop Now
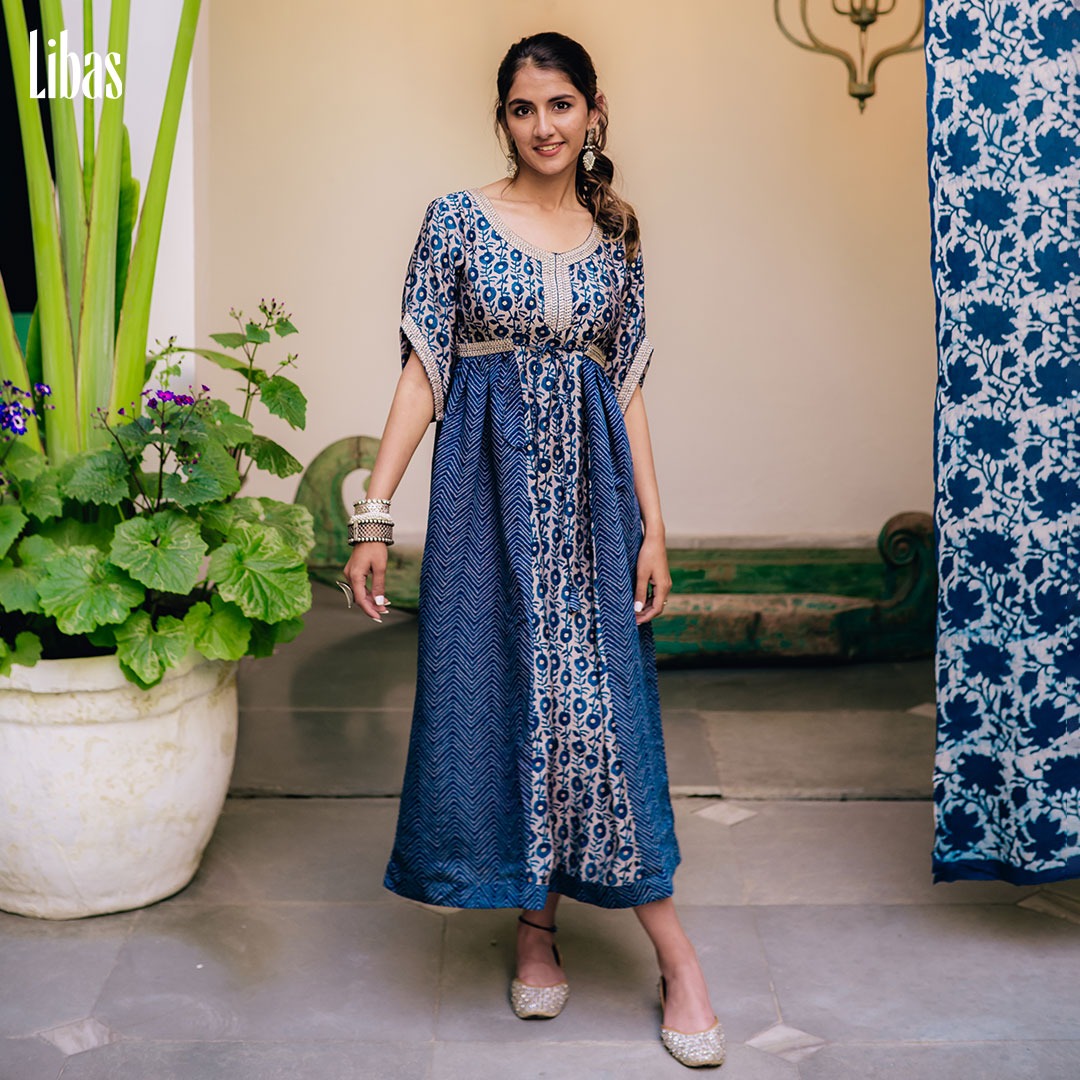
Card 5 of 5
Introducing Indigo - Spring Summer 2022
Shop Now
View in Meta Ad Library →
Cookd
Food and Drink
3 cards
What the cards do: Catalogue: one dish combo per card, same Order Now button.
“Prepare yourself for a burst of mouth watering flavours and a hint of fiery spice!🔥<br /> <br /> With the Biryani Combo, you can make a mouth-watering 65 Biryani in just 30 minutes.😋<br /> <br /> Our biryani kit is: <br /> <br /> ✅100%…”
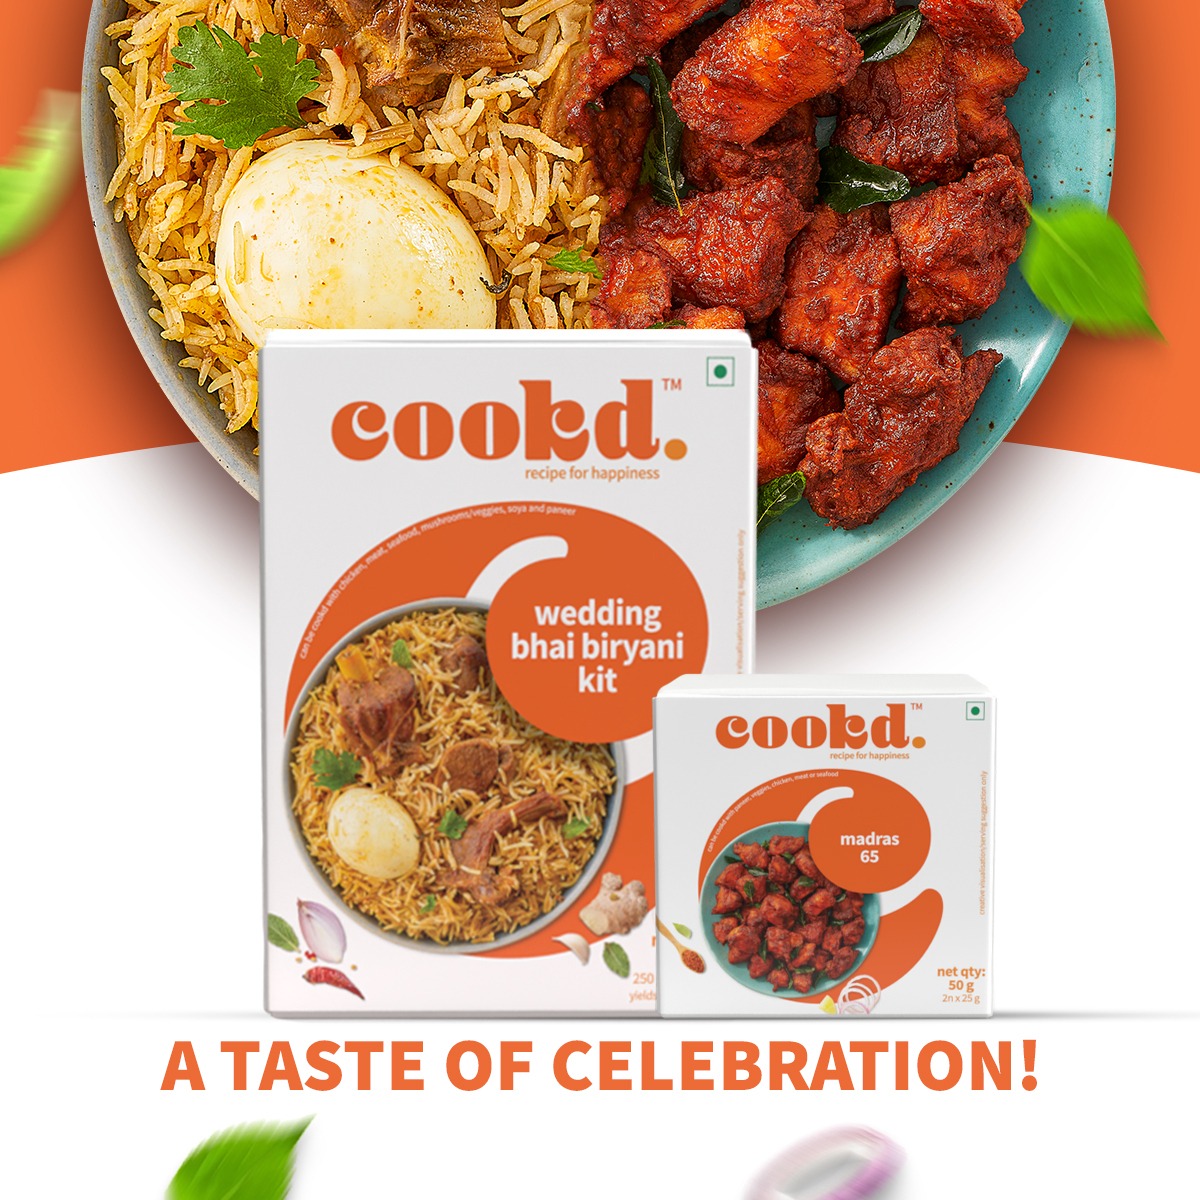
Card 1 of 3
Wedding Bhai Biryani + Madras 65
Order Now
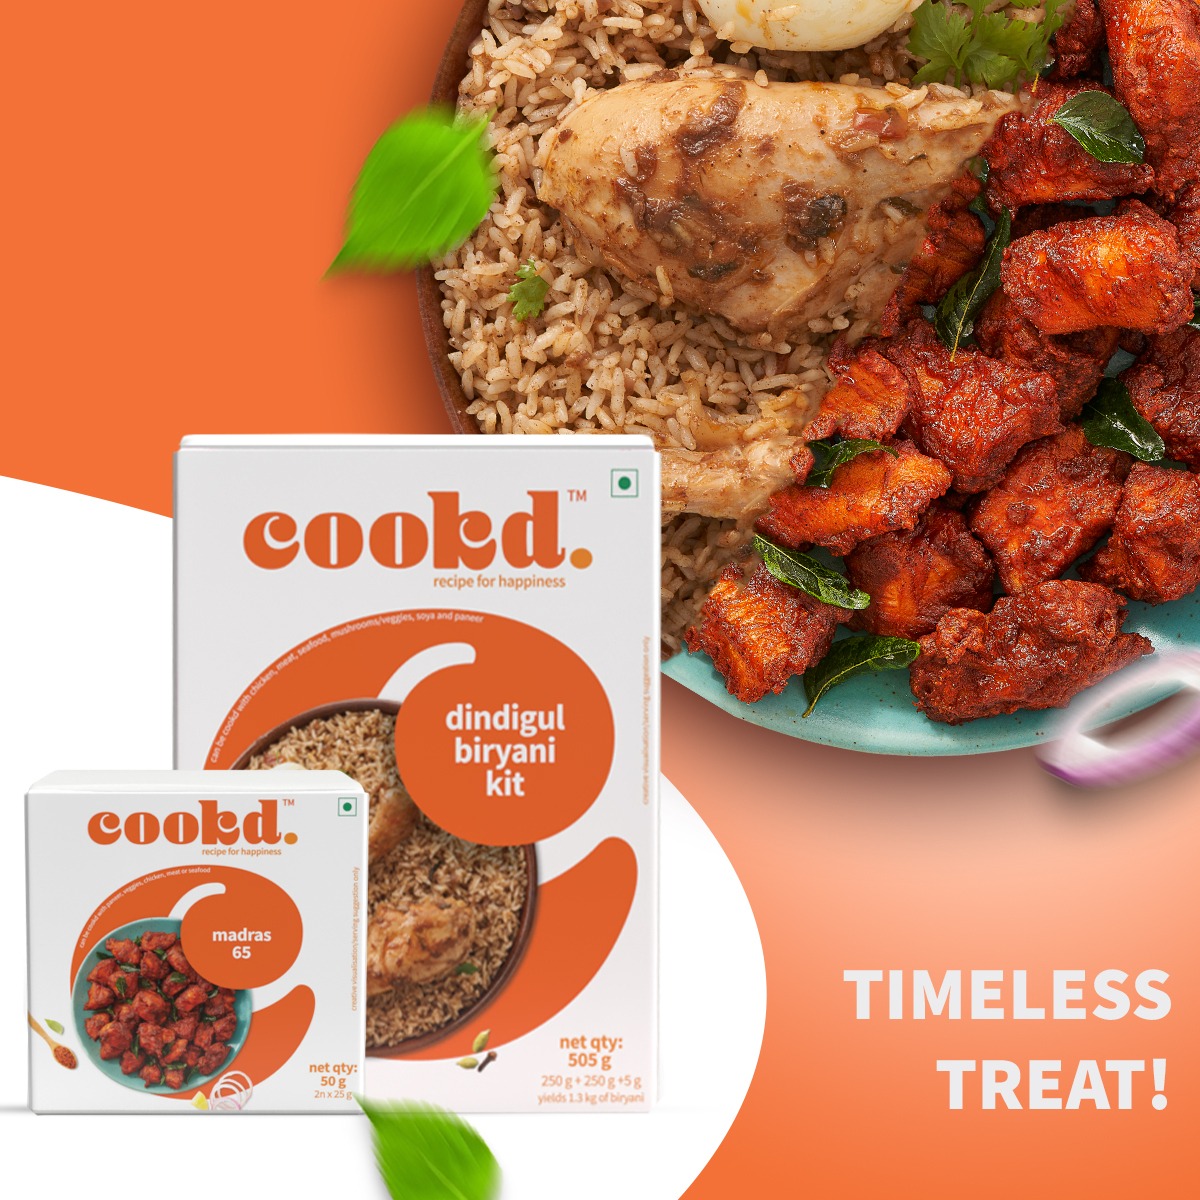
Card 2 of 3
Dindigual Biryani + Madras 65
Order Now
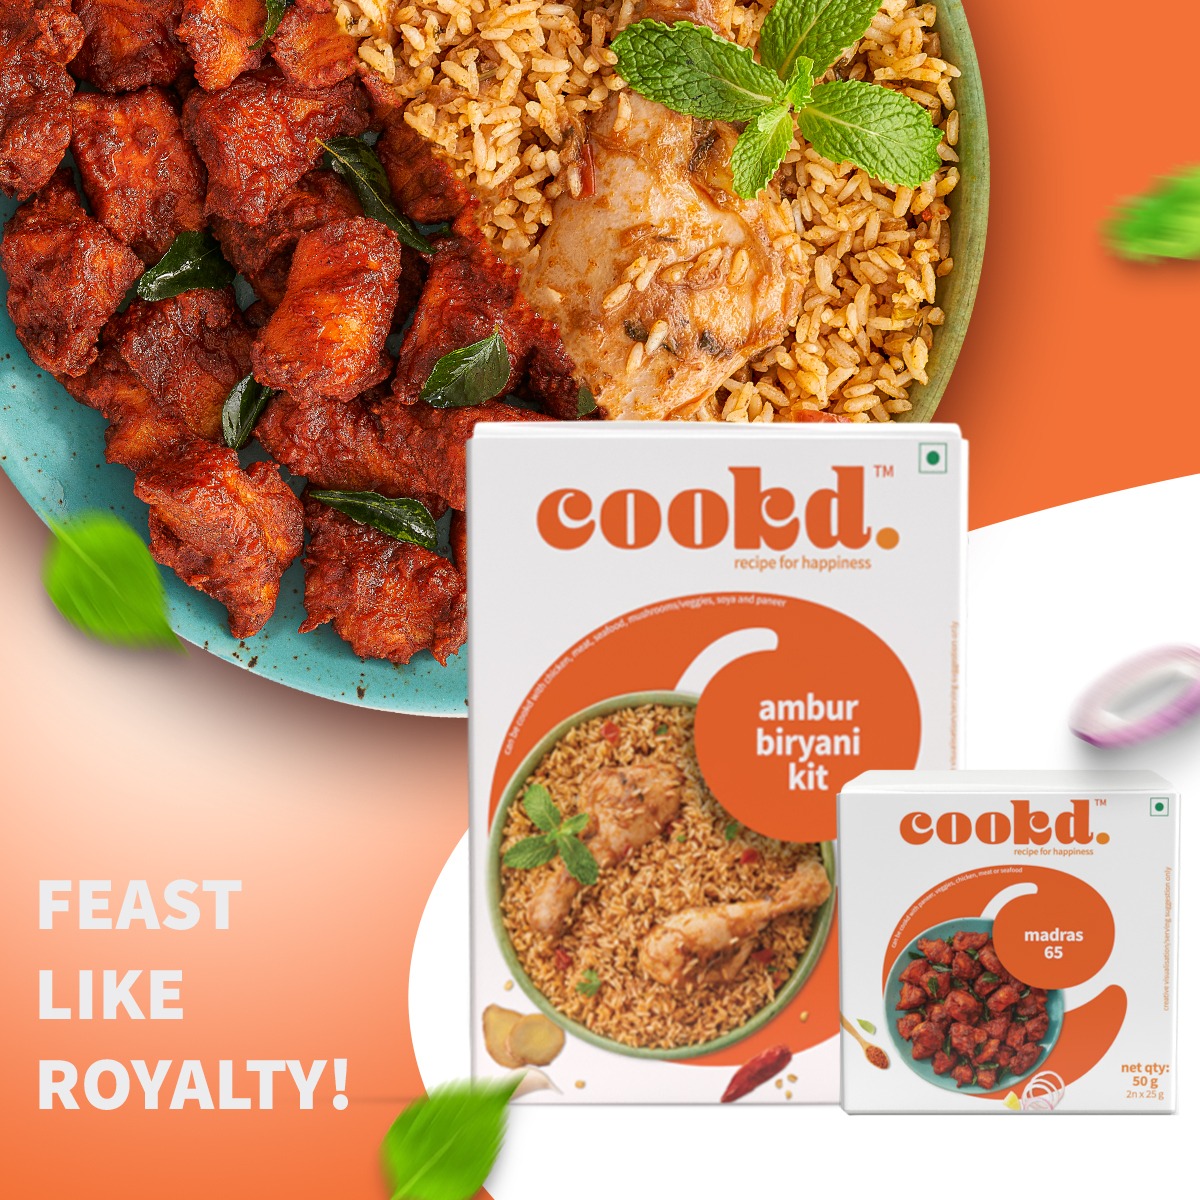
Card 3 of 3
Ambur Biryani + Madras 65
Order Now
View in Meta Ad Library →
OYL Mushroom Coffee
Food and Drink
8 cards
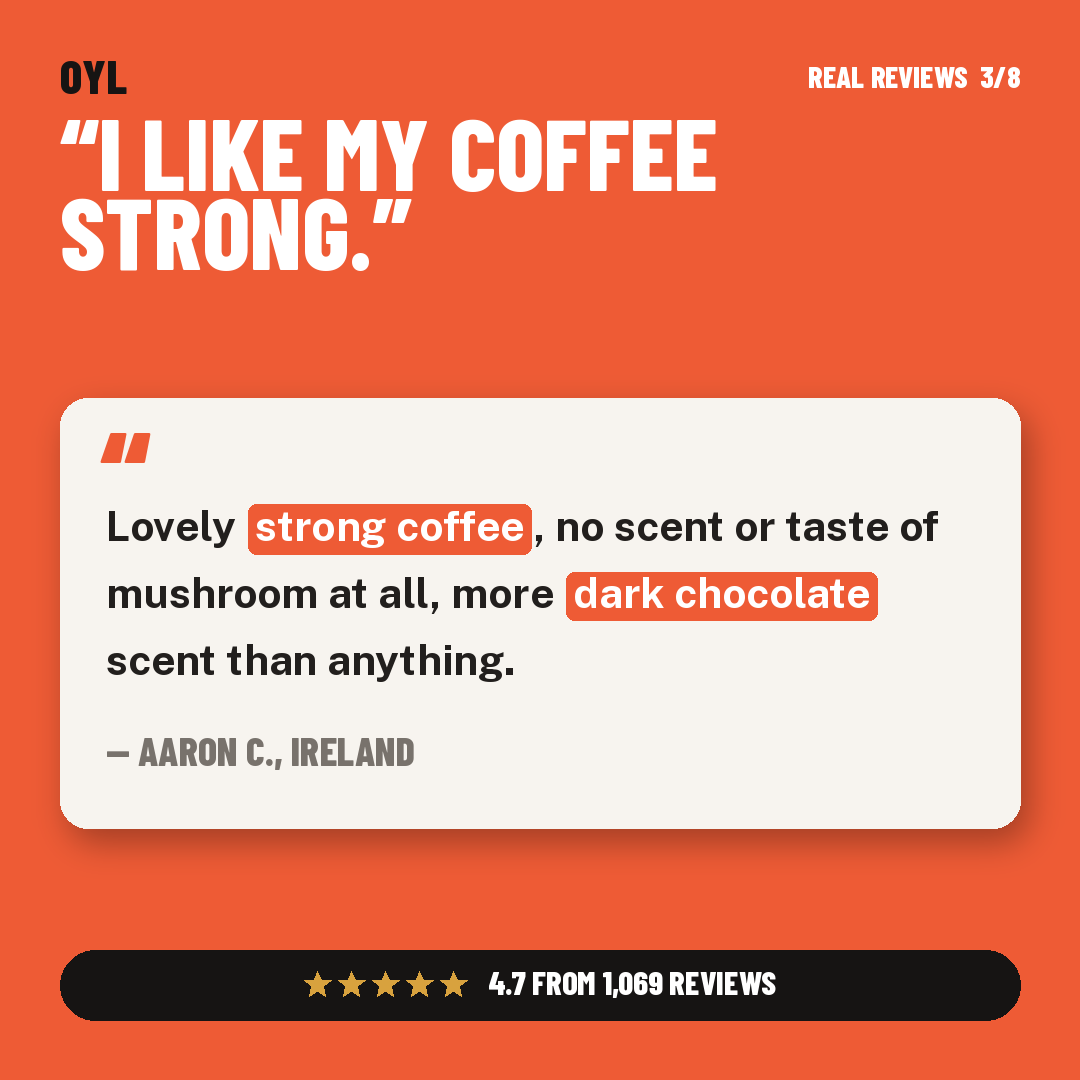
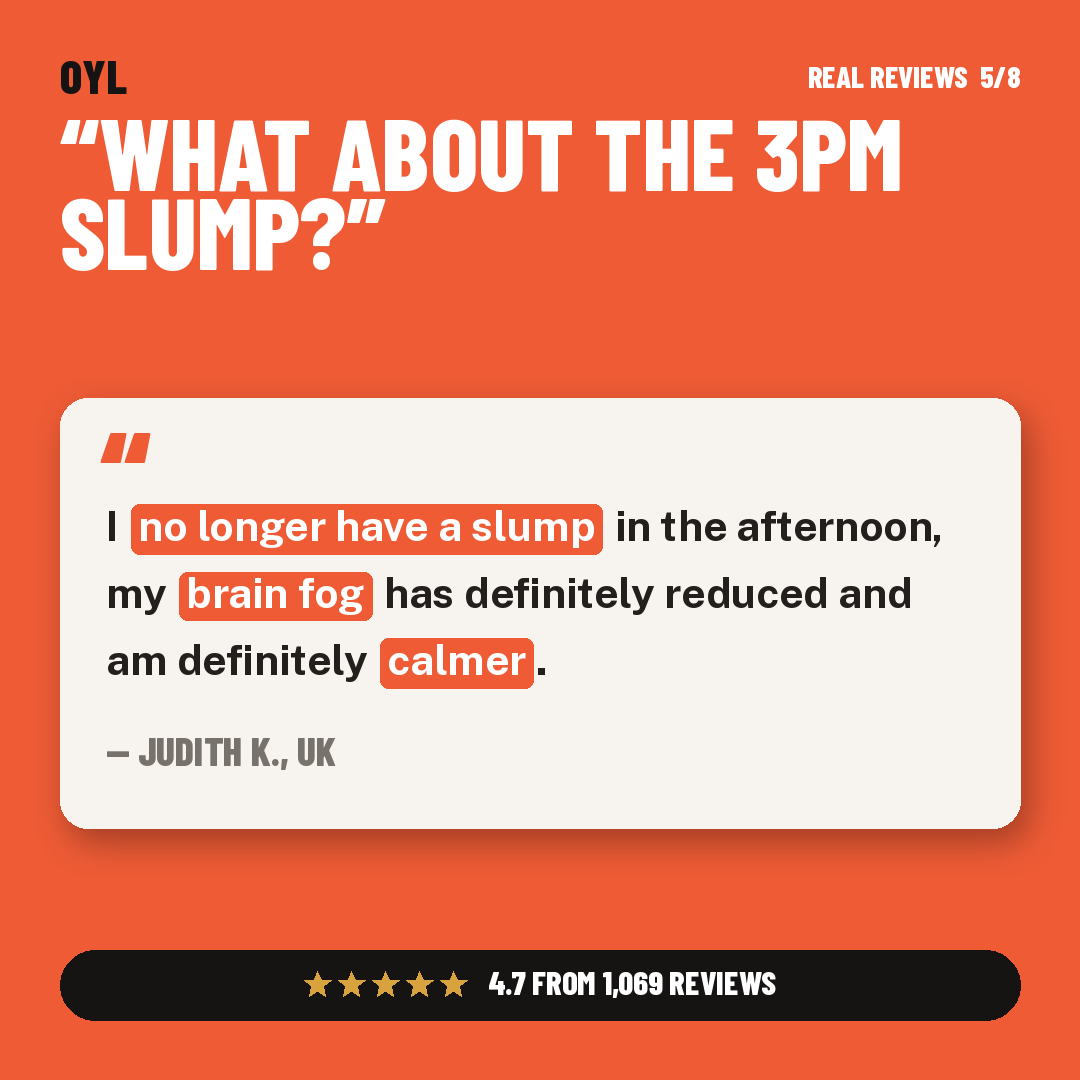
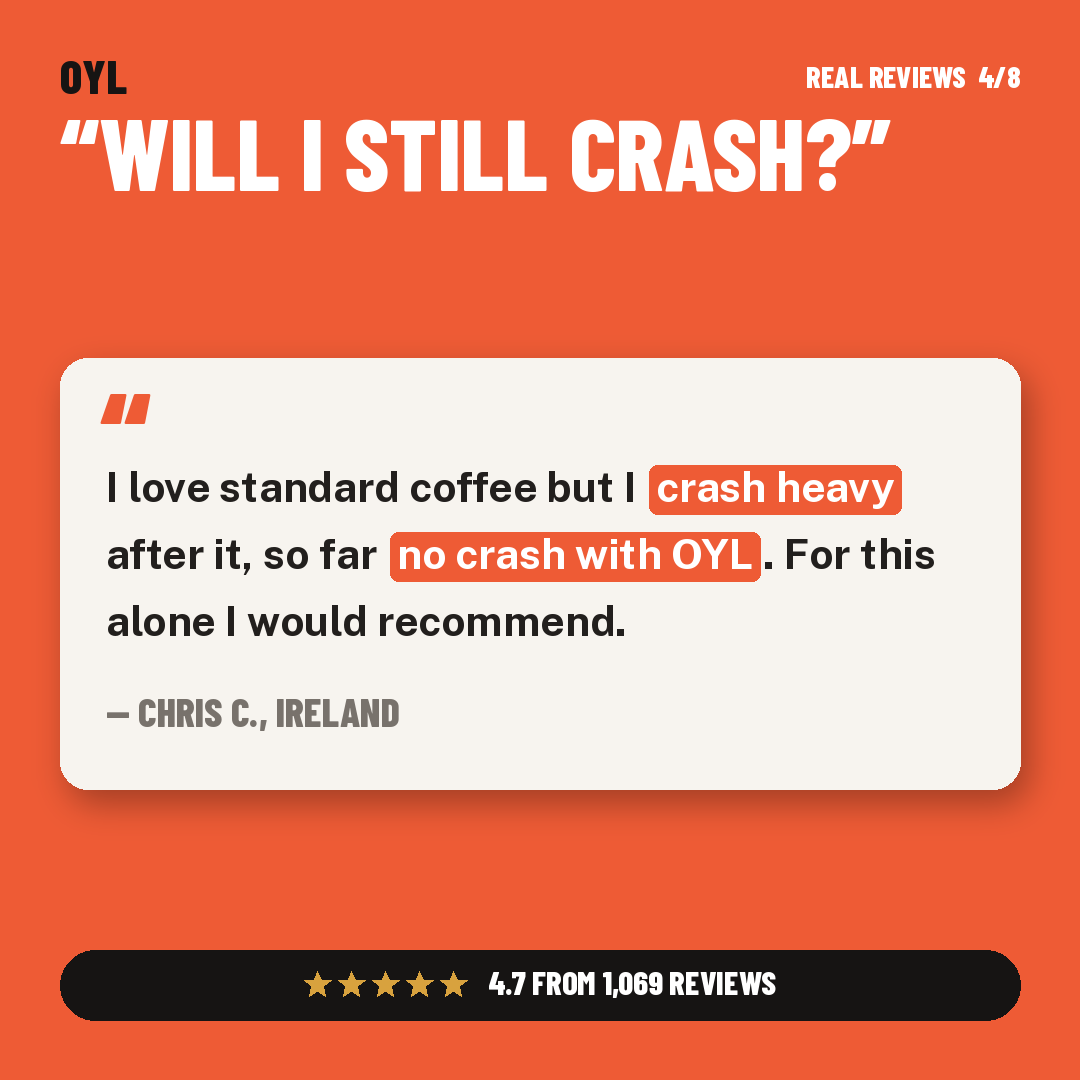
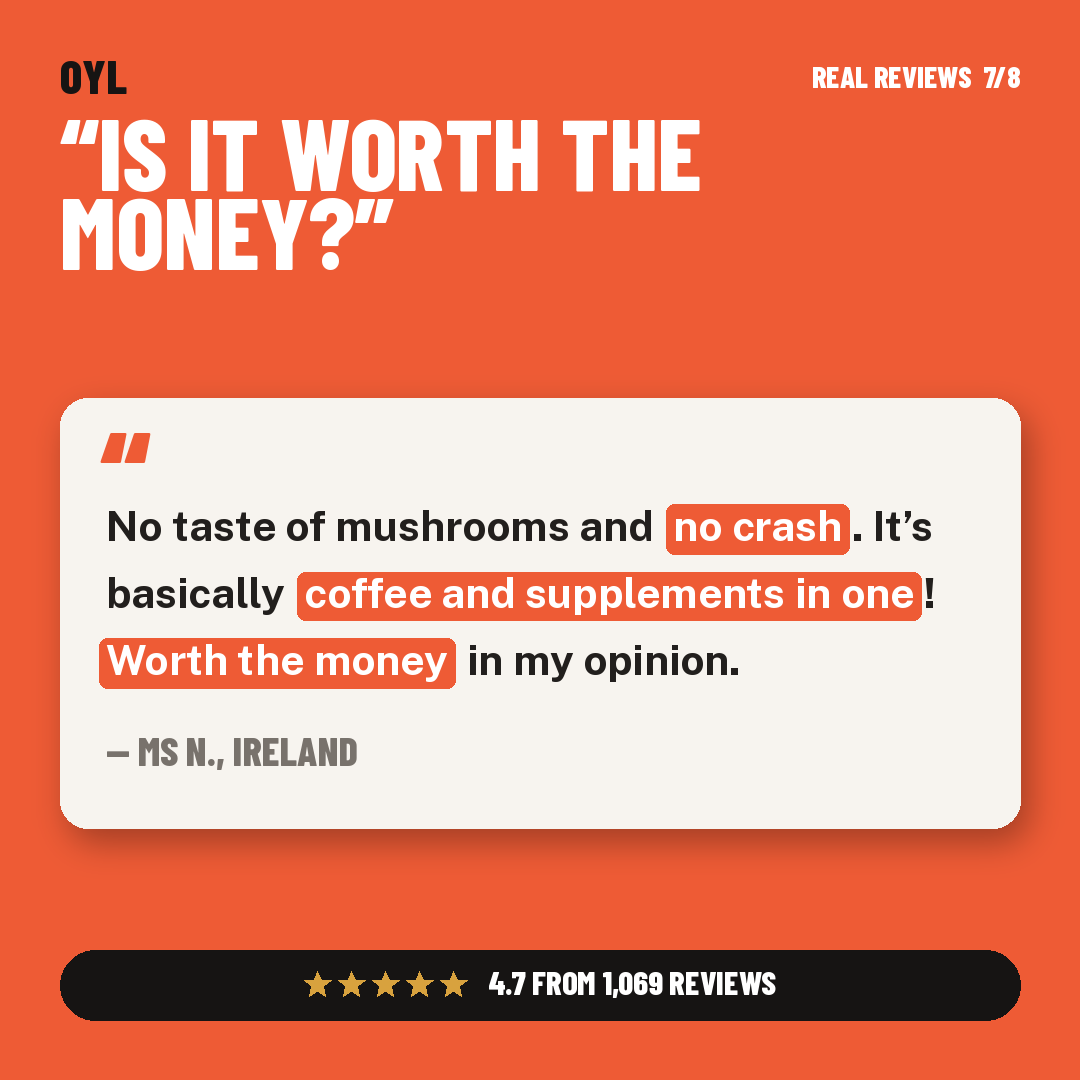
What the cards do: Offer first, then taste objection and a money-back card to close.
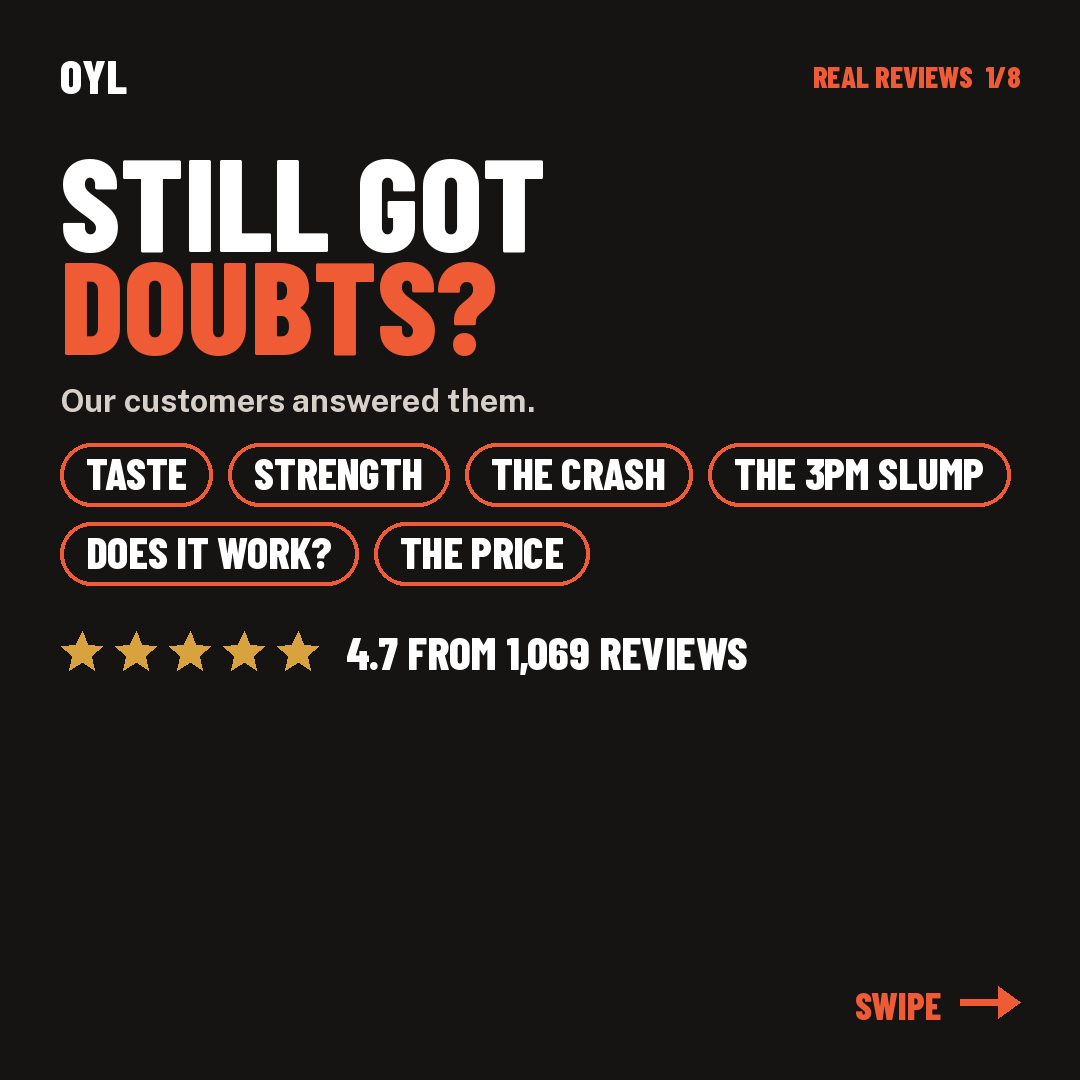
Card 1 of 8
BLACK FRIDAY: SAVE 58% 🍄
€79.99 (Was €191)
See Details
Card 2 of 8
Our Biggest Sale of the Year
€79.99 (Was €191)
See Details
Card 3 of 8
Energy and focus 🍄
€79.99 (Was €191)
See Details
Card 4 of 8
BLACK FRIDAY: SAVE 58% 🍄
€79.99 (Was €191)
See Details
Card 5 of 8
BLACK FRIDAY: SAVE 58% 🍄
€79.99 (Was €191)
See Details
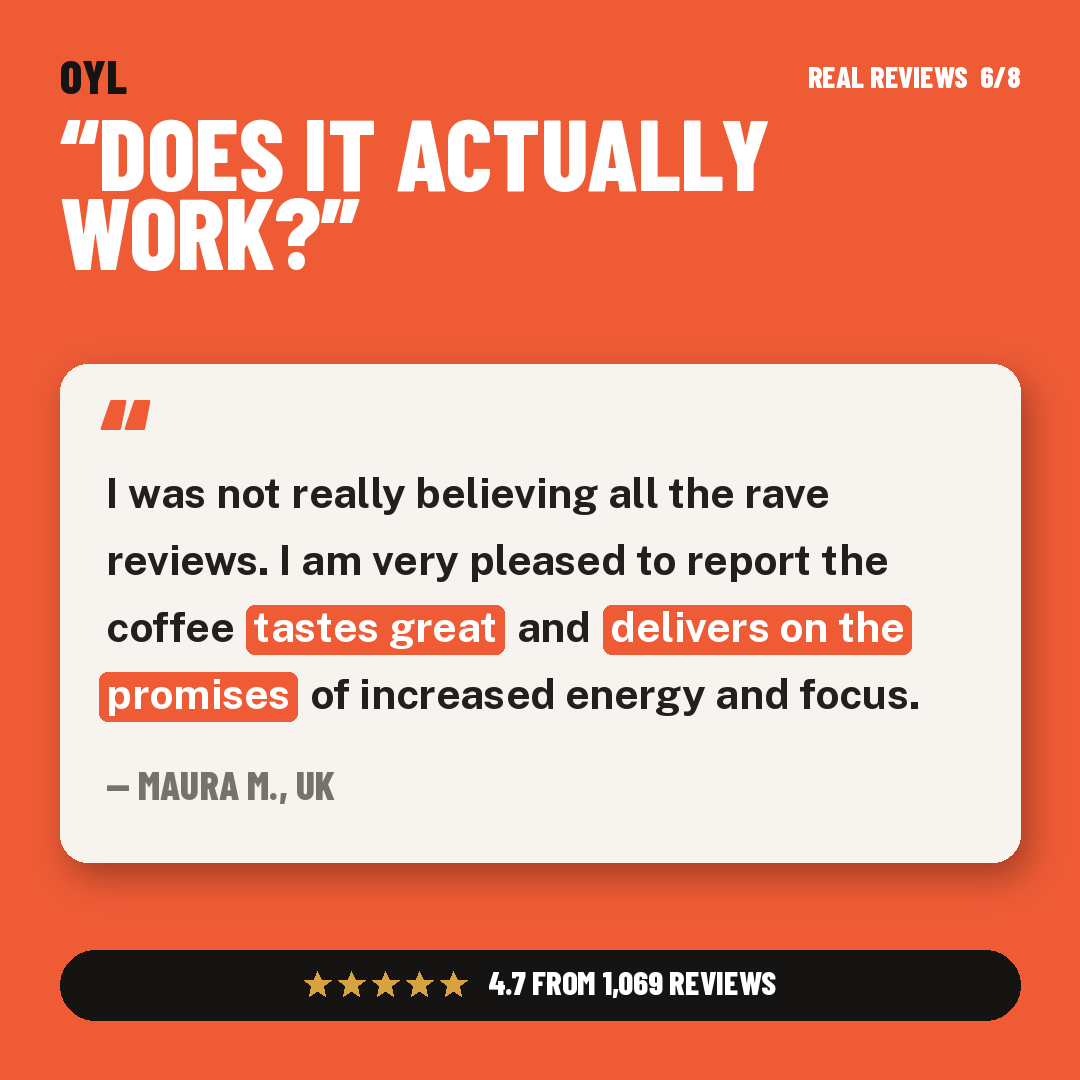
Card 6 of 8
BLACK FRIDAY: SAVE 58% 🍄
€79.99 (Was €191)
See Details
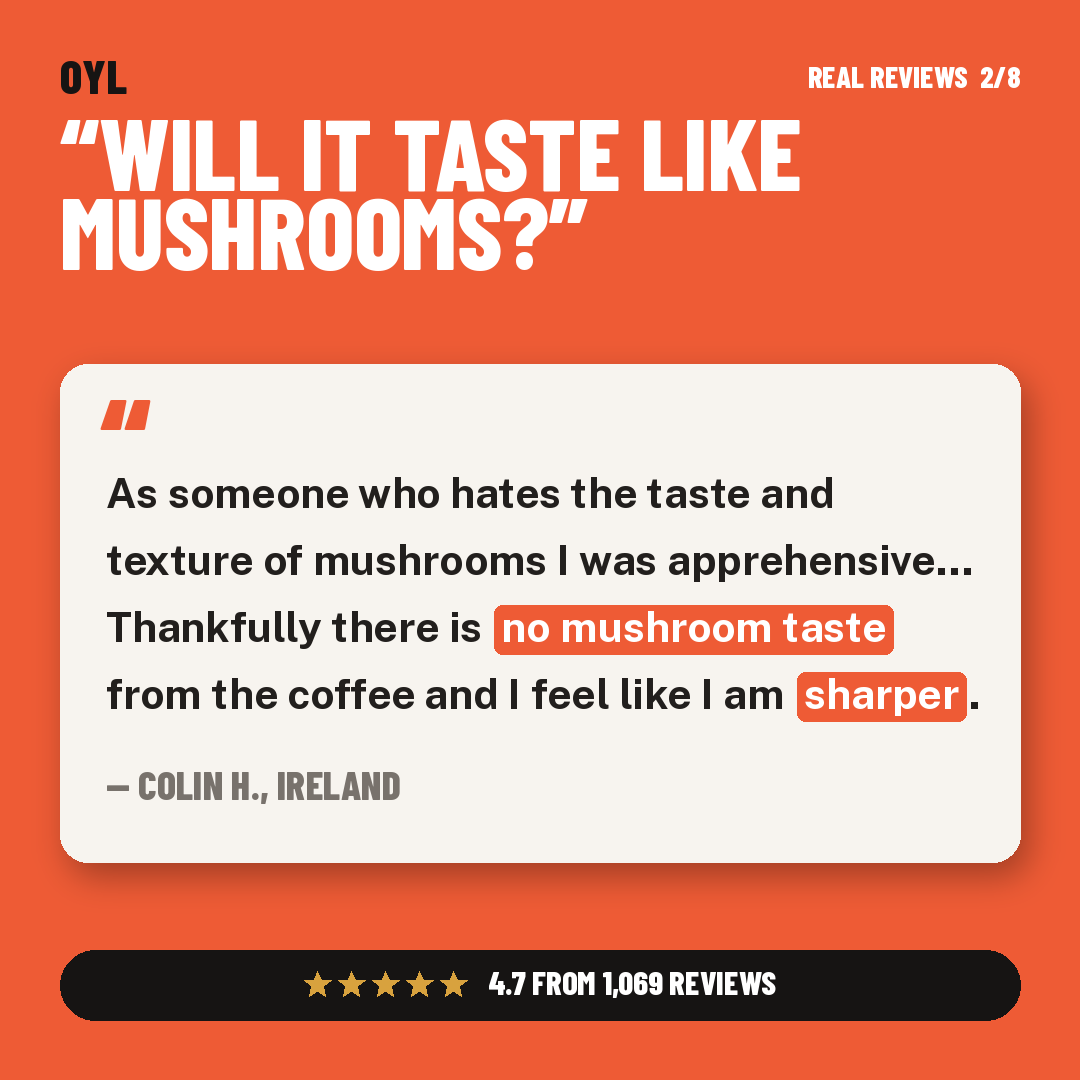
Card 7 of 8
Doesn't Taste Like Mushrooms
€79.99 (Was €191)
See Details

Card 8 of 8
Money back guaranteed!
€79.99 (Was €191)
See Details
View in Meta Ad Library →
IncrediPets
Pets
5 cards
What the cards do: Steps: each card removes one hassle, ending on "Register now".
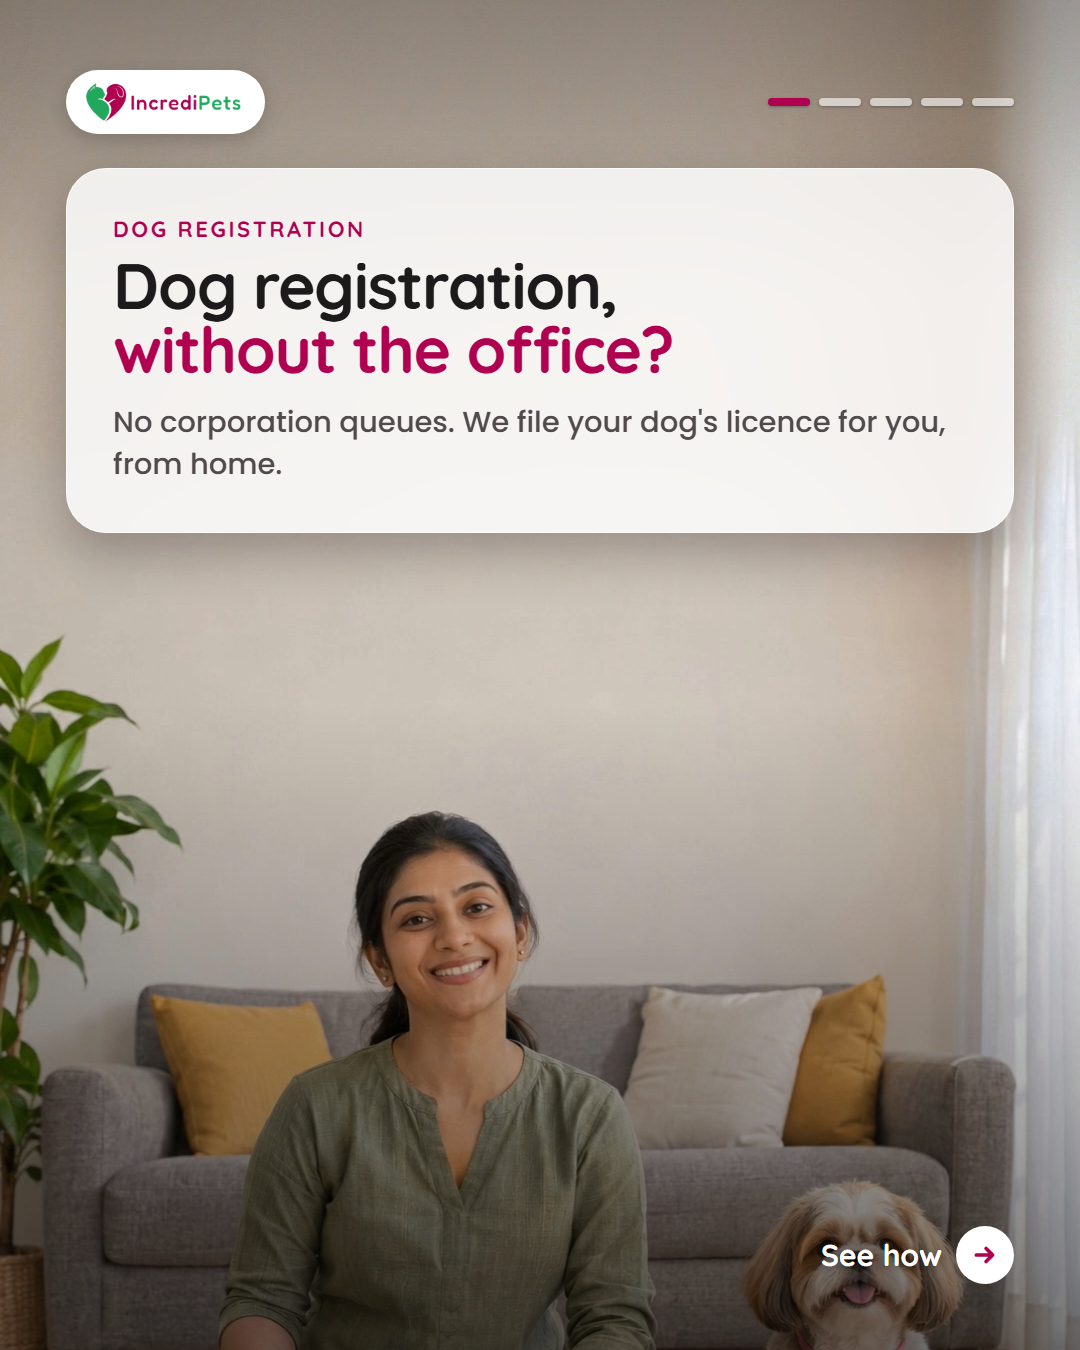
Card 1 of 5
Without the office
Apply Now
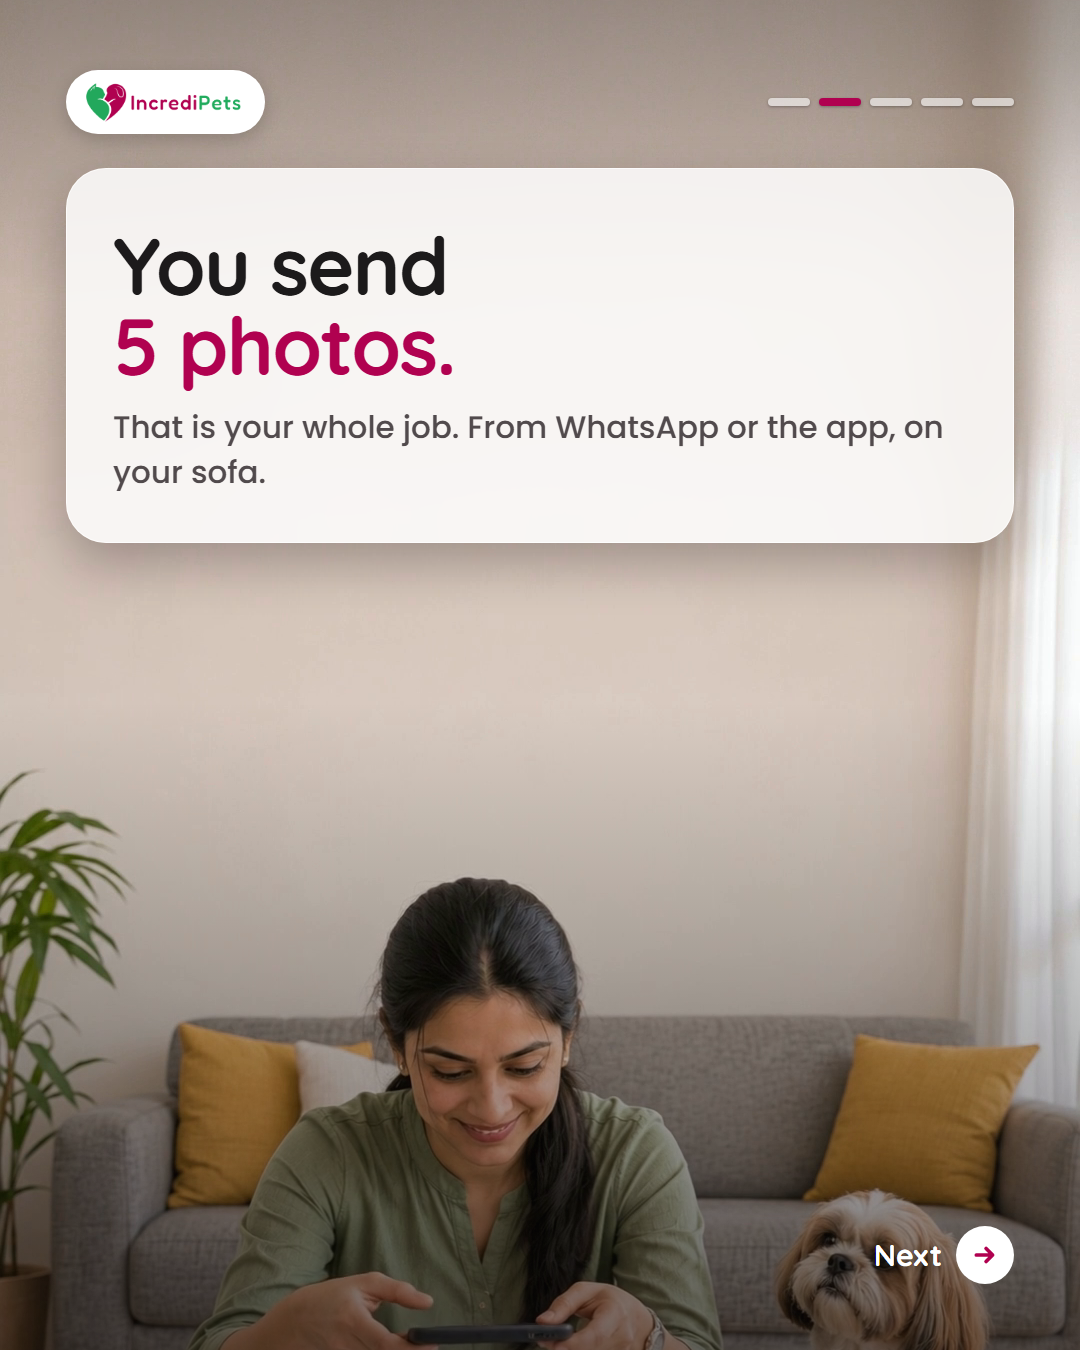
Card 2 of 5
Just 5 minutes
Apply Now

Card 3 of 5
We file it for you
Apply Now
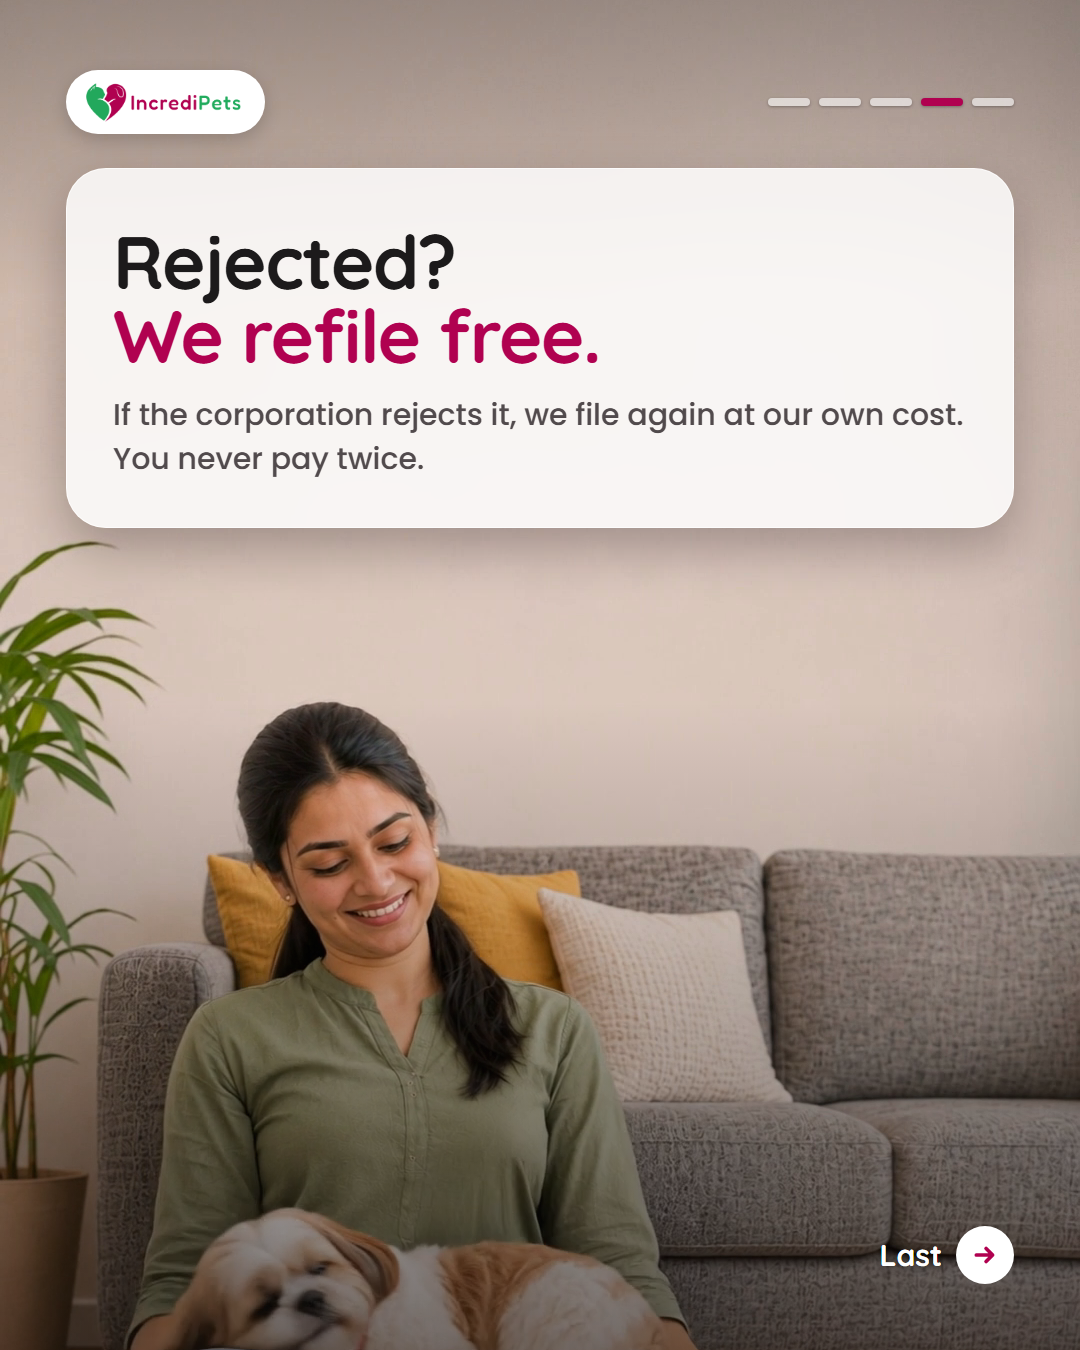
Card 4 of 5
We refile free
Apply Now
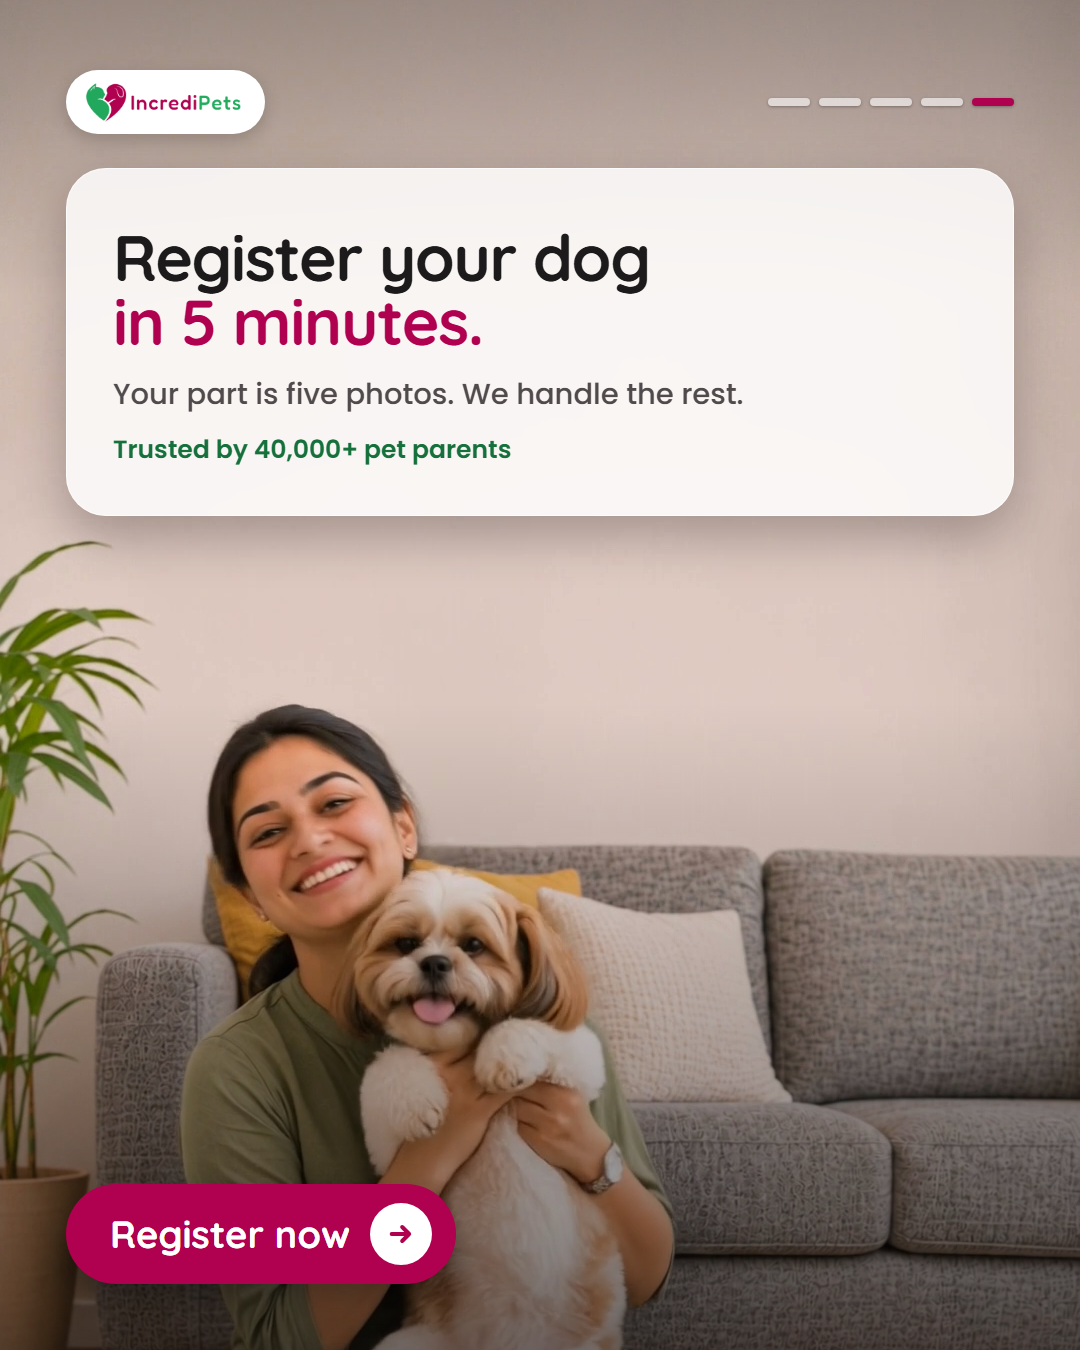
Card 5 of 5
Register now
Apply Now
View in Meta Ad Library →
BYJU'S
Education
5 cards
What the cards do: Steps: test, scholarship, skills, percentile, prize.

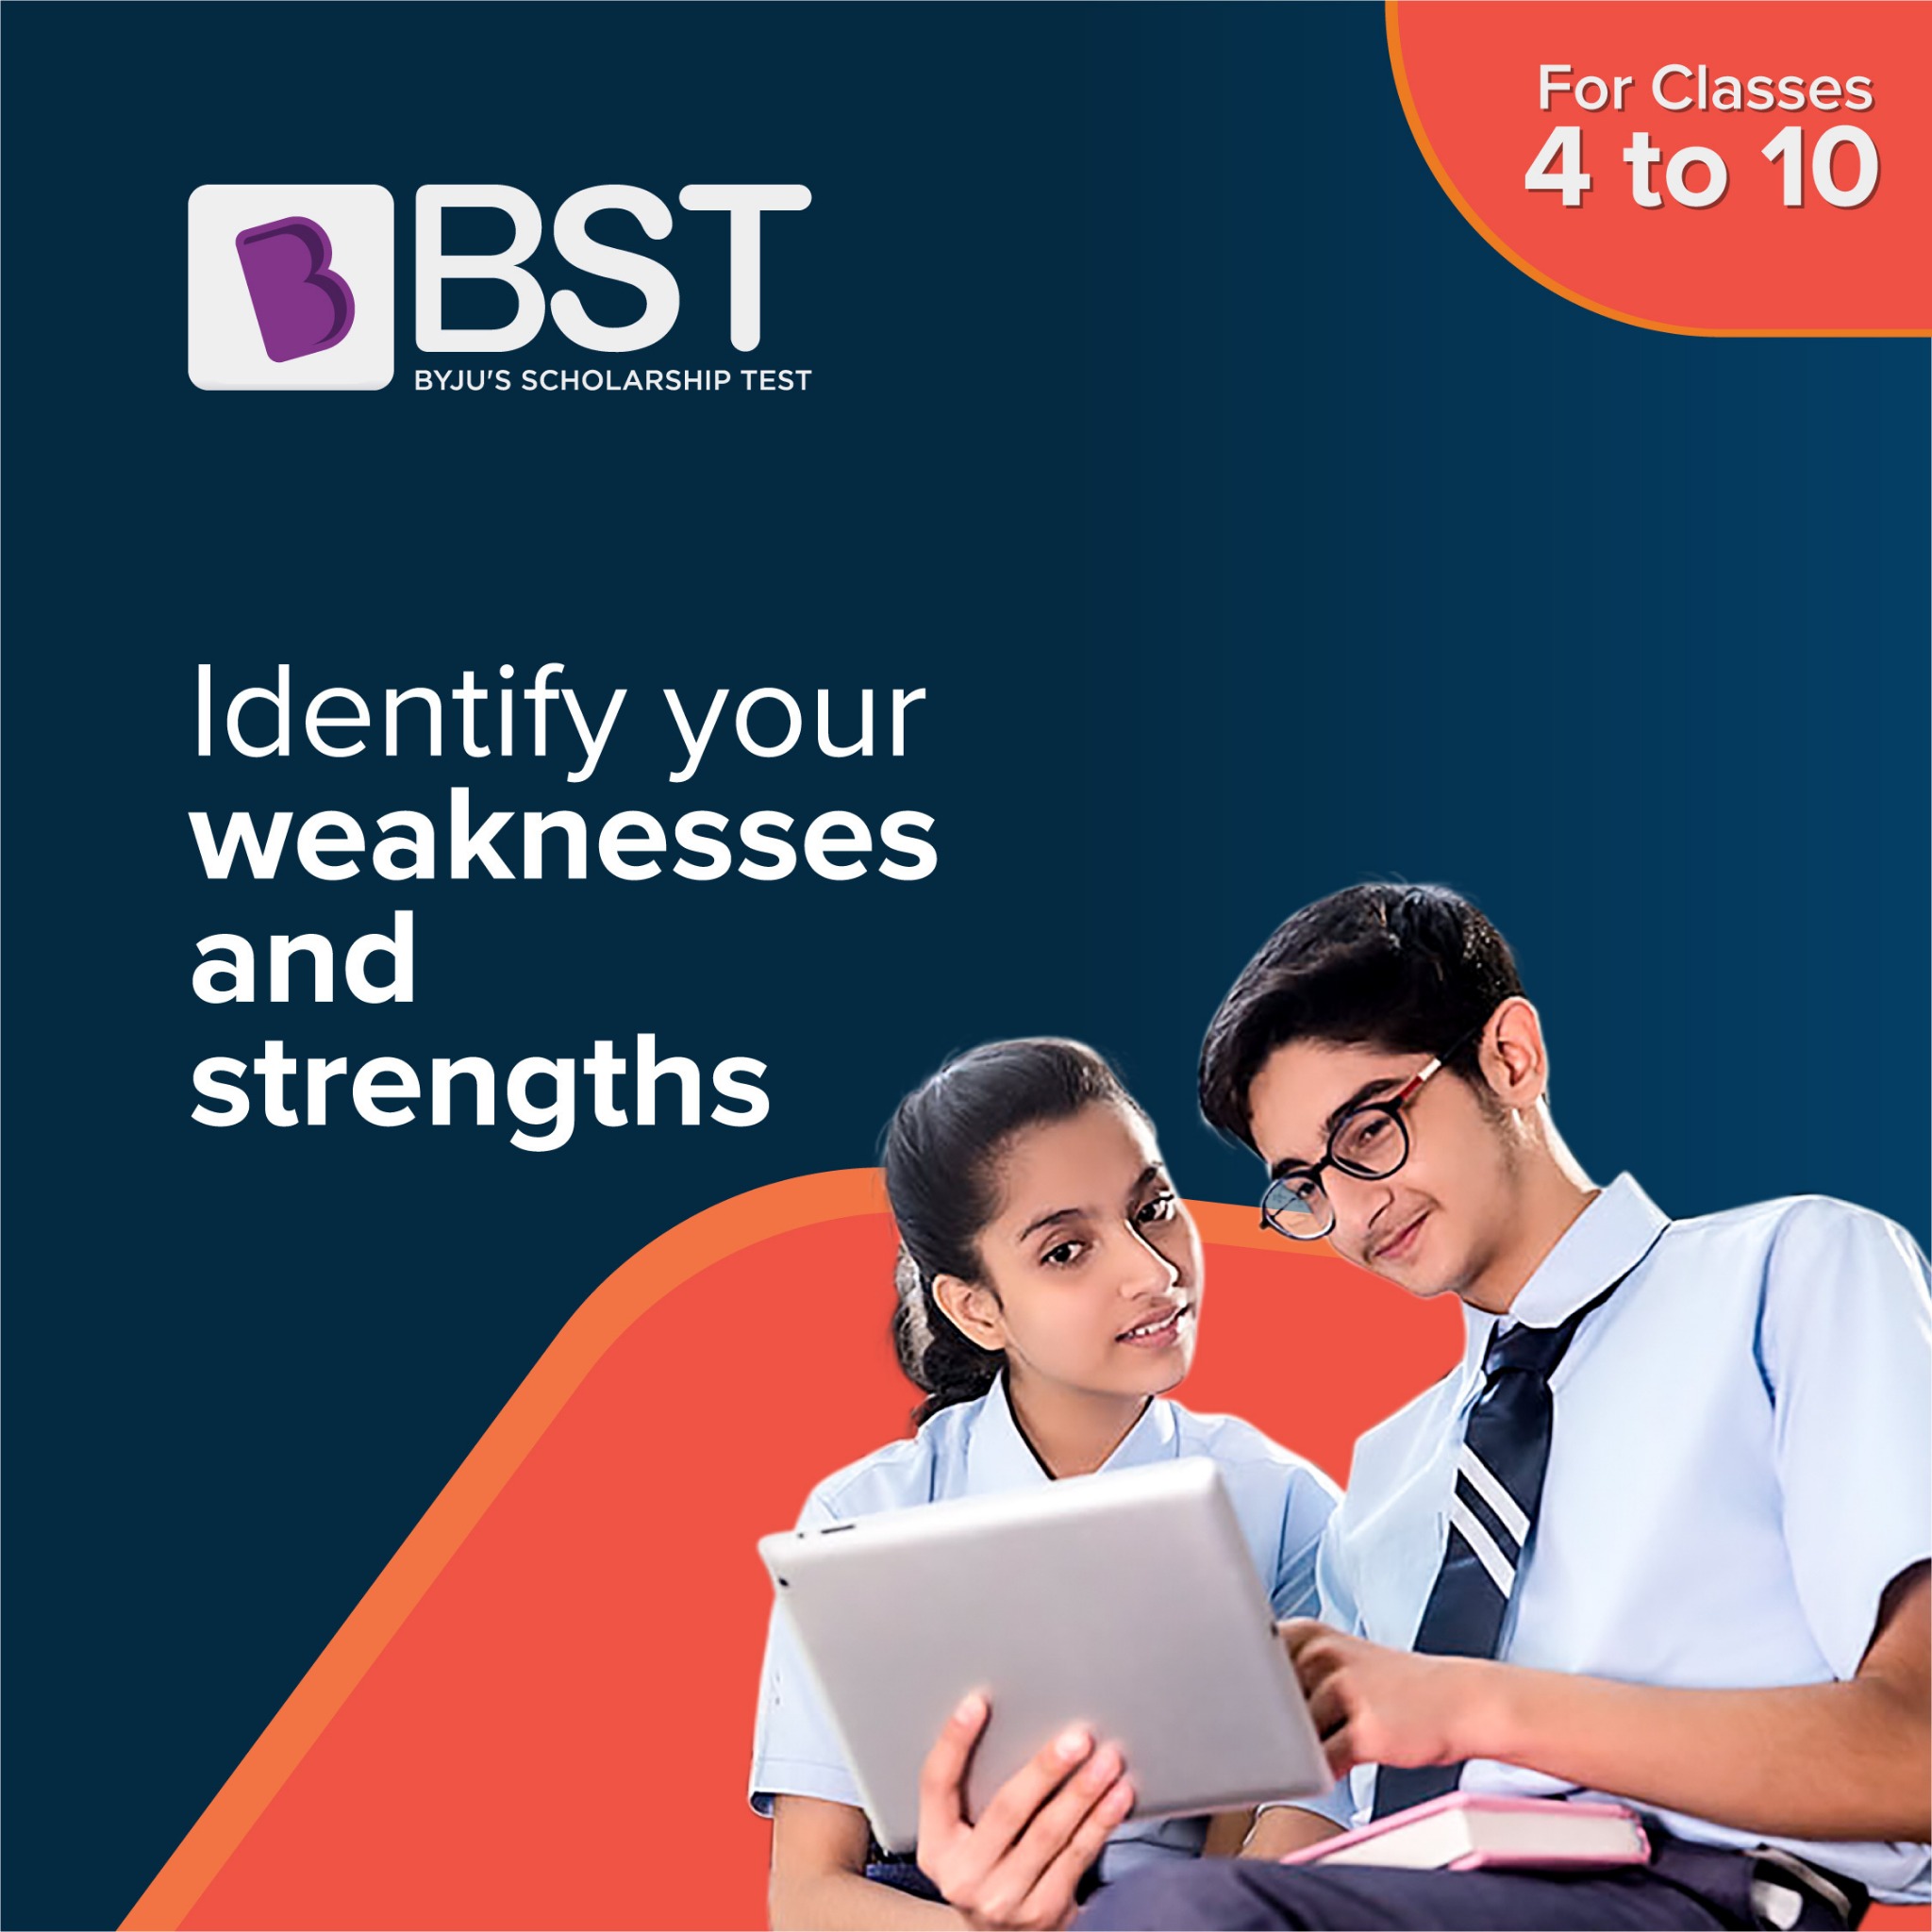
Card 1 of 5
Test your conceptual understanding.
For classes 4-10
Apply Now

Card 2 of 5
Get scholarships on BYJU'S programs
All India test
Apply Now
Card 3 of 5
Analyse your academic skills
100% online
Apply Now

Card 4 of 5
Get an all-India percentile
Benchmark yourself
Apply Now

Card 5 of 5
Win up to a 100% scholarship
Don’t miss it!
Apply Now
View in Meta Ad Library →
Musora
Education
6 cards
What the cards do: Product per card, bookended by two deal cards.

Card 1 of 6
Black Friday Door Crashers From $9
Shop Now
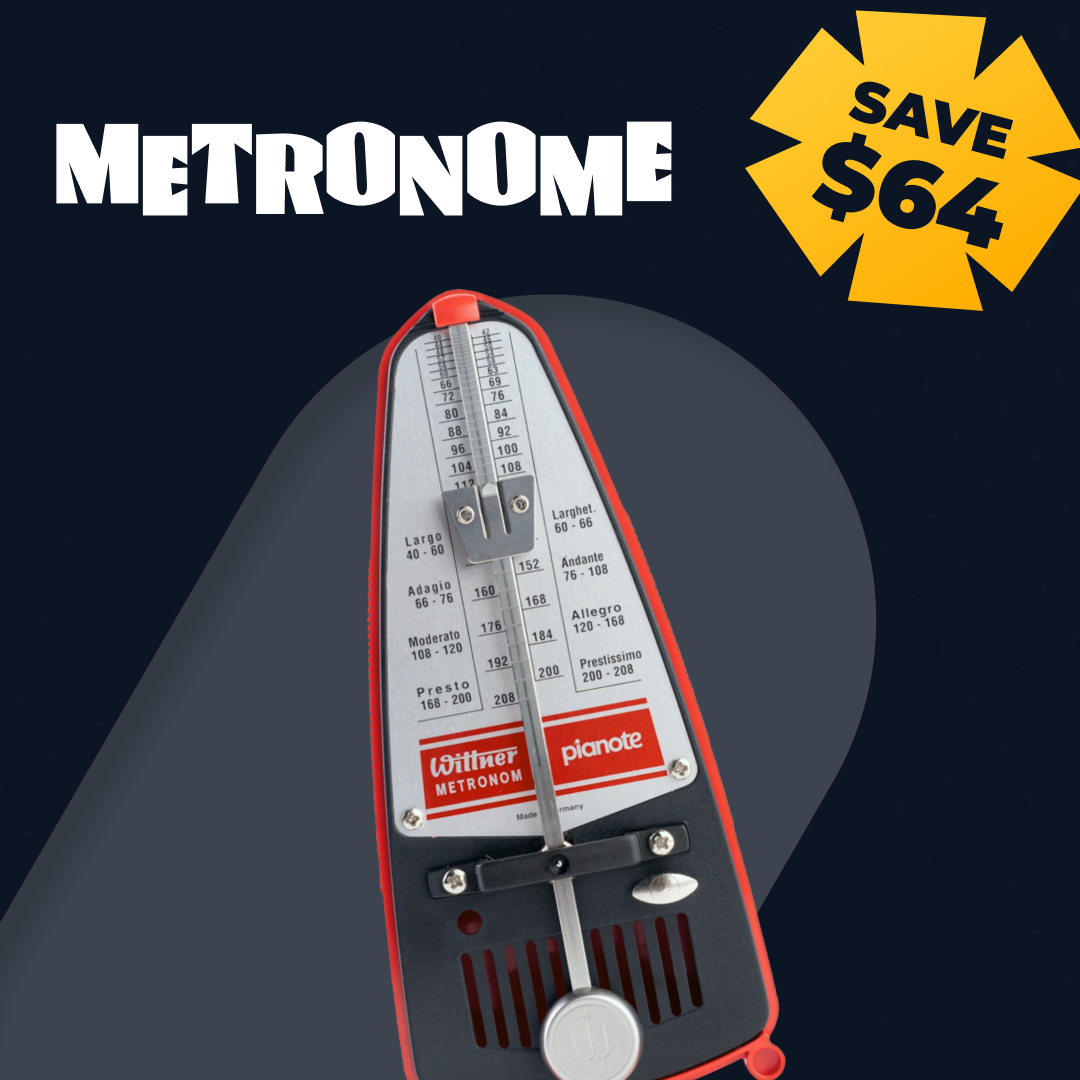
Card 2 of 6
Keep Steady Time, Every Practice
Shop Now

Card 3 of 6
20 Carols, Ready to Play This Year
Shop Now

Card 4 of 6
Hear Every Note, Practice for Hours
Shop Now

Card 5 of 6
Save $100 + 3 Bonus Courses
Shop Now

Card 6 of 6
Shop All the Black Friday Piano Deals
Shop Now
View in Meta Ad Library →
Sleeping Duck
Home and Garden
7 cards
What the cards do: Three product variants first, then two video cards on how the bed is built.

Card 1 of 7
The SD Indestruct - Haussman
Learn More
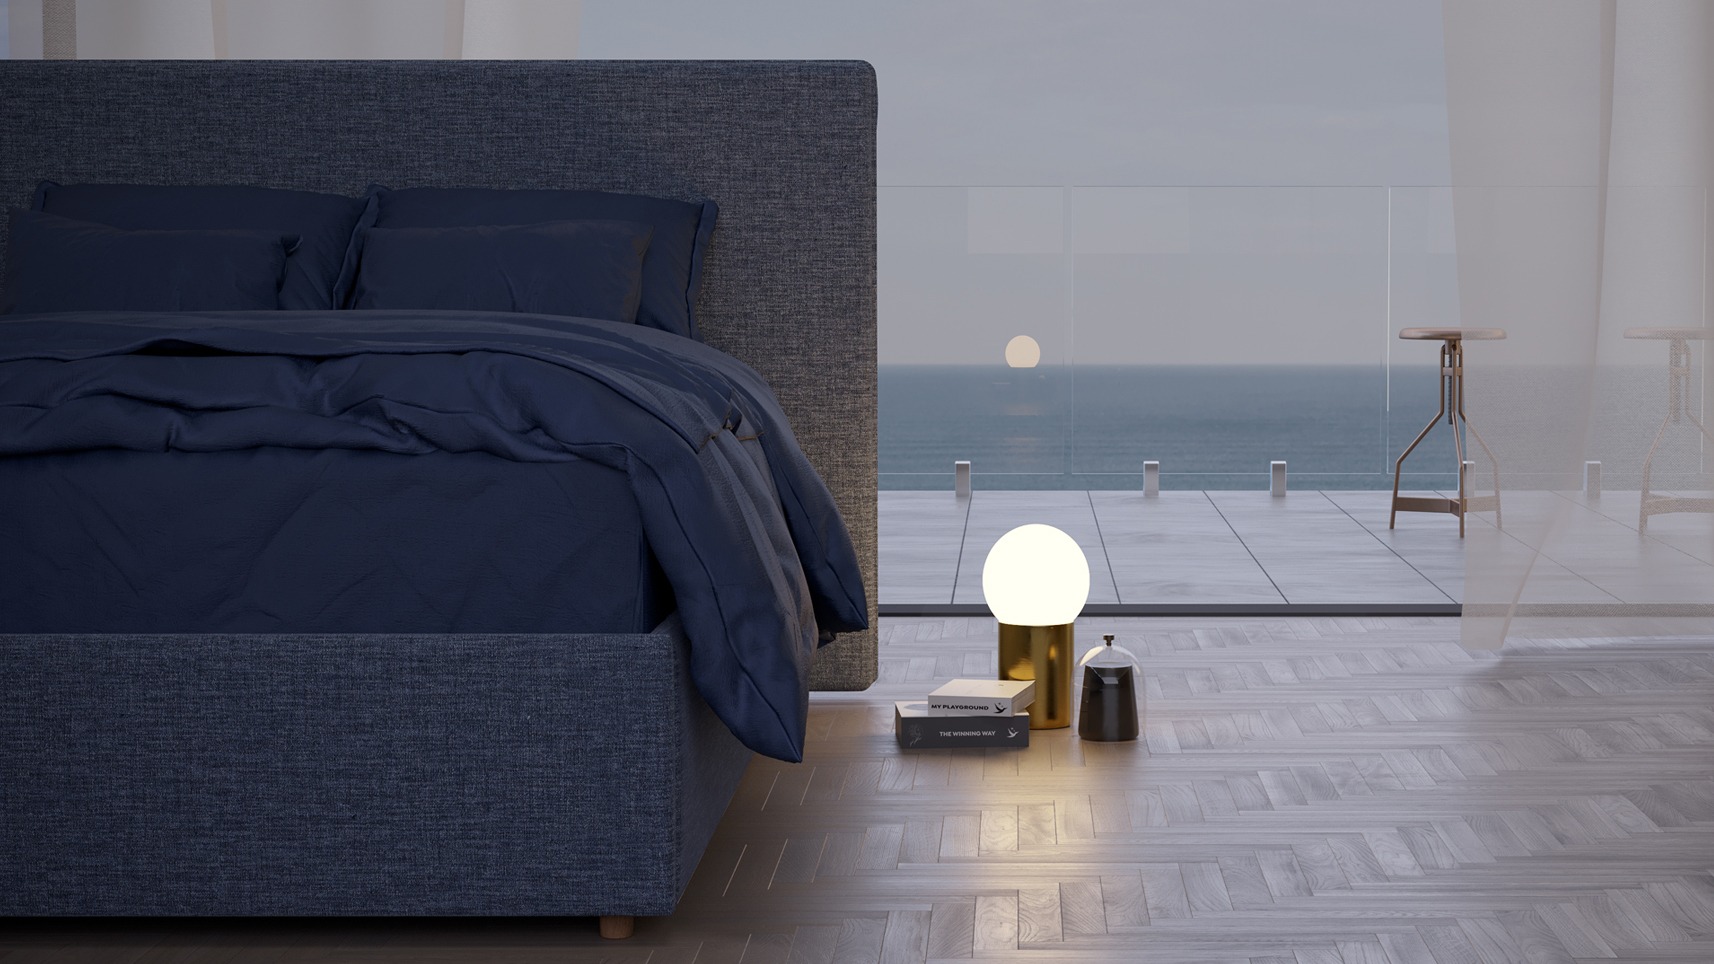
Card 2 of 7
The SD Indestruct - SeaSpray
Learn More
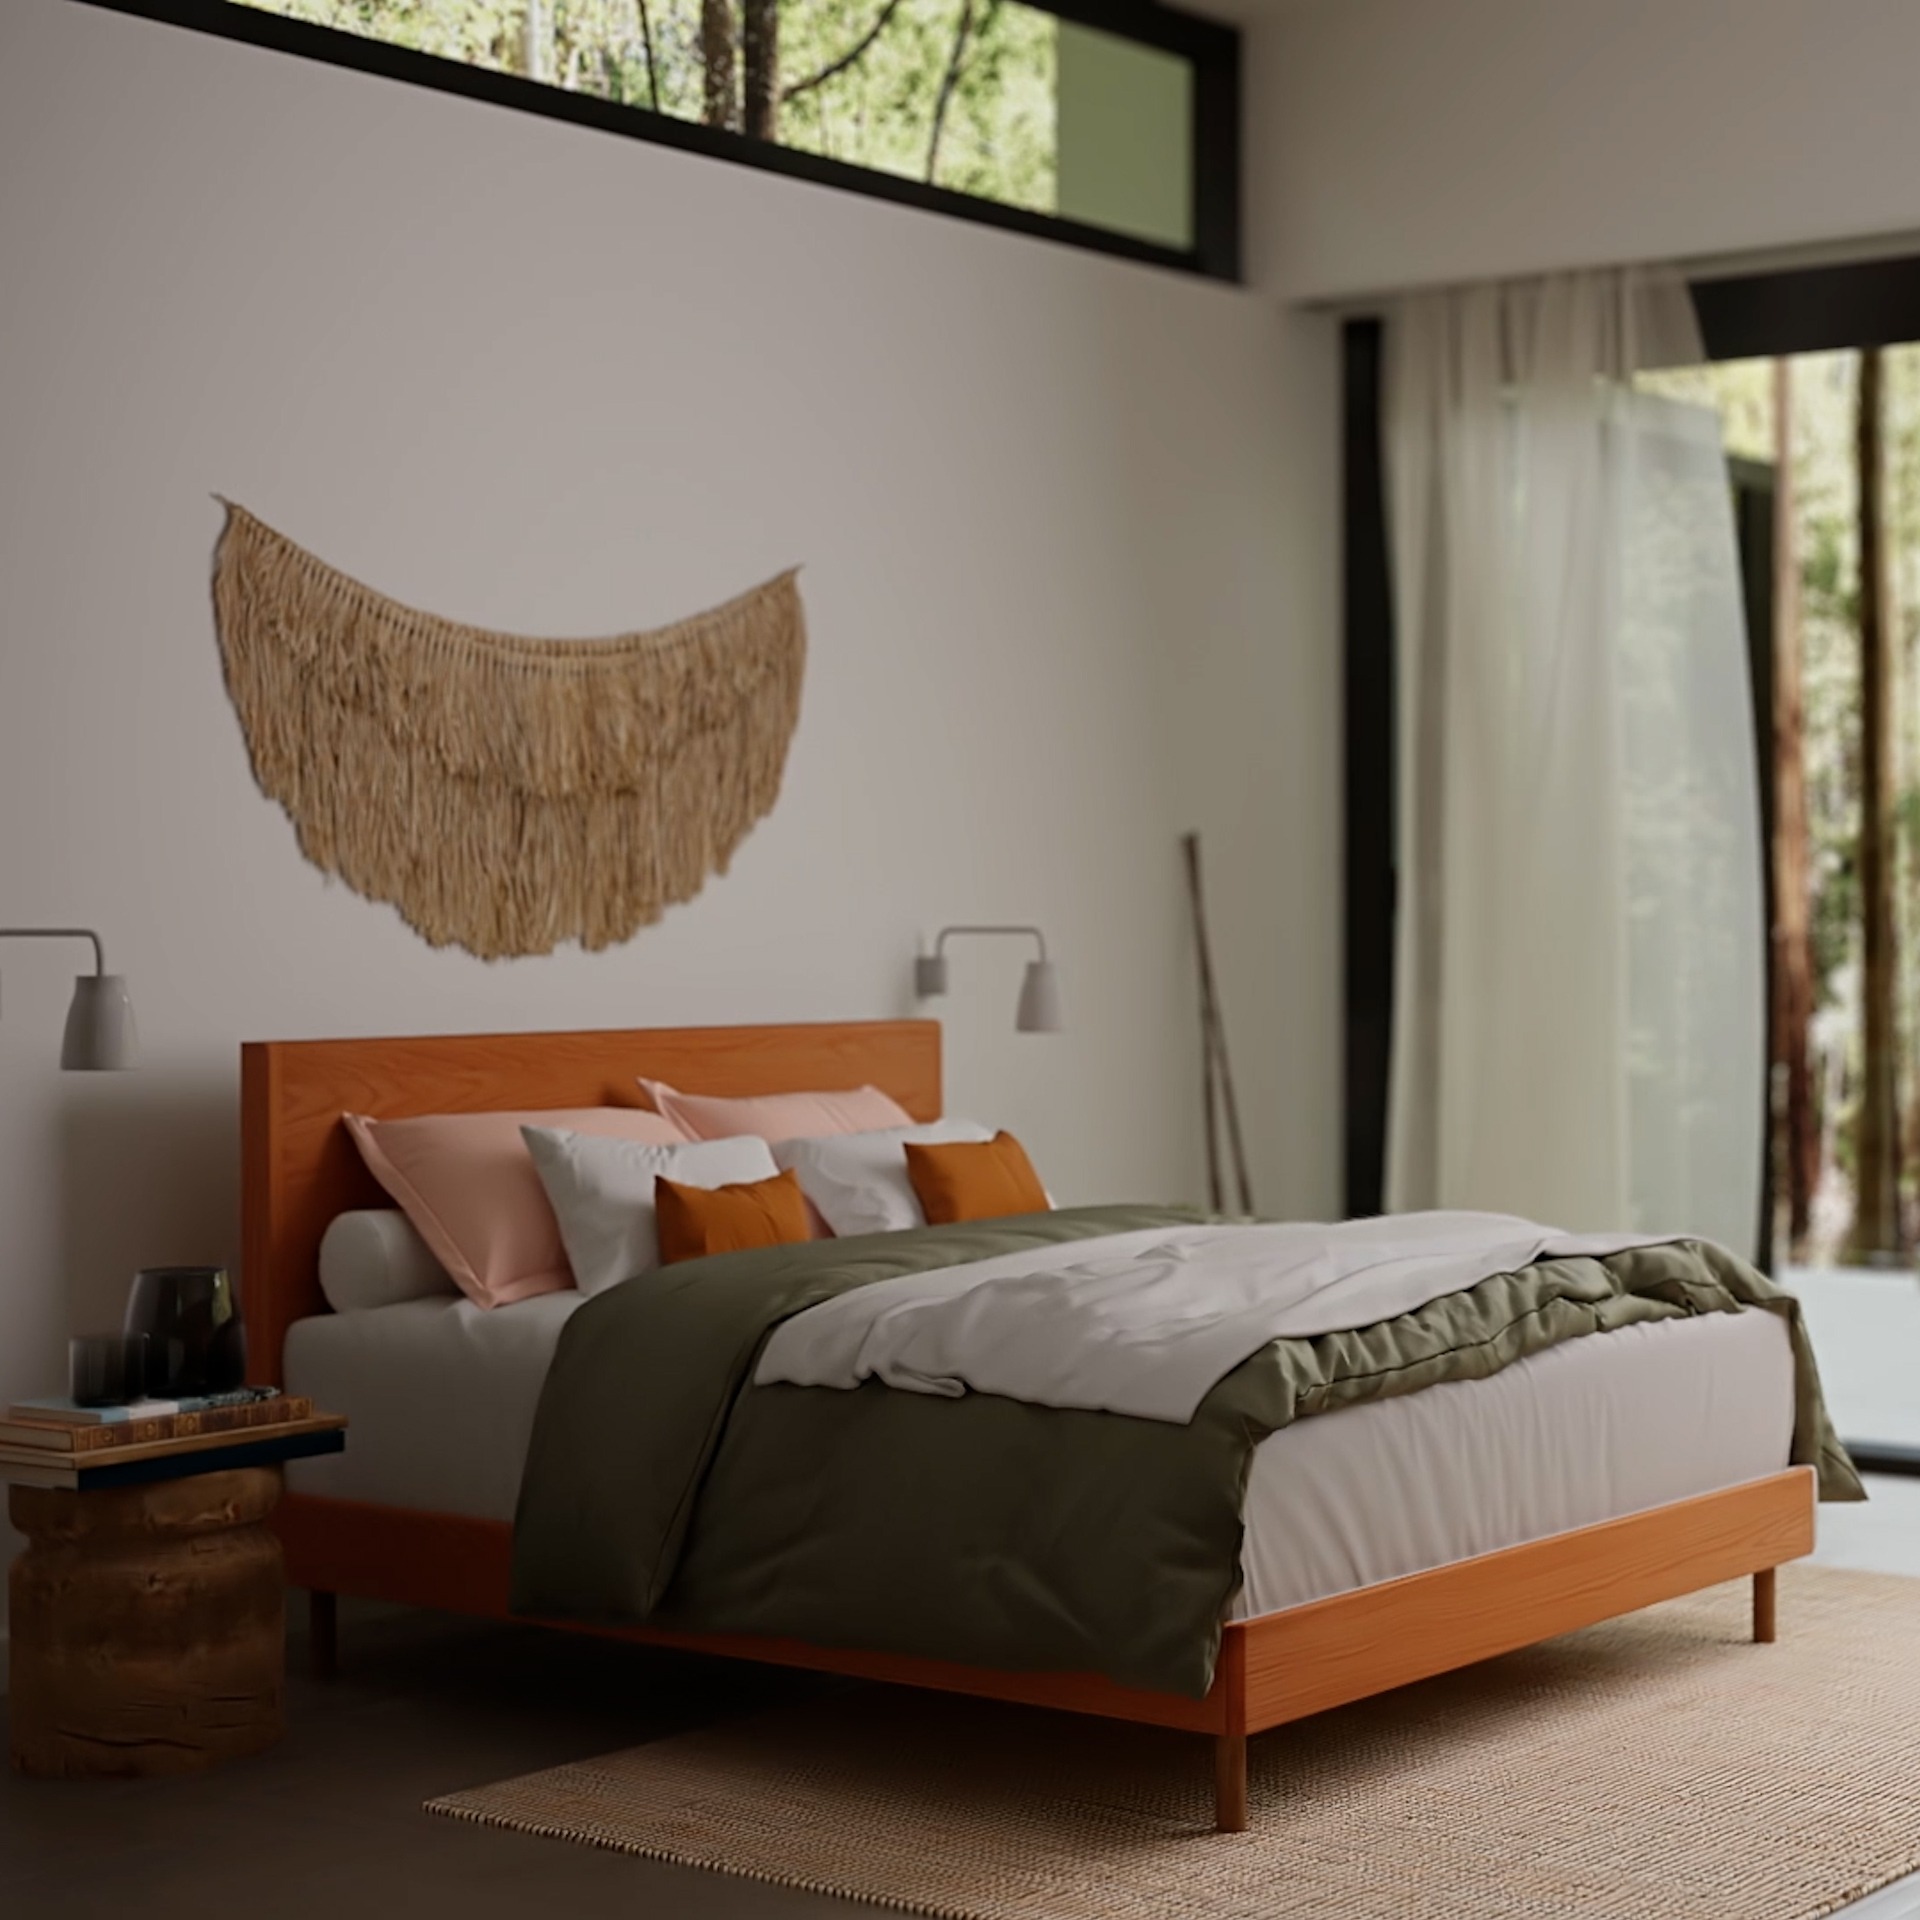
Card 3 of 7
The SD Indestruct - Baker
Learn More
Card 4 of 7 · video
Attachable skins and mattress support panels
Learn More
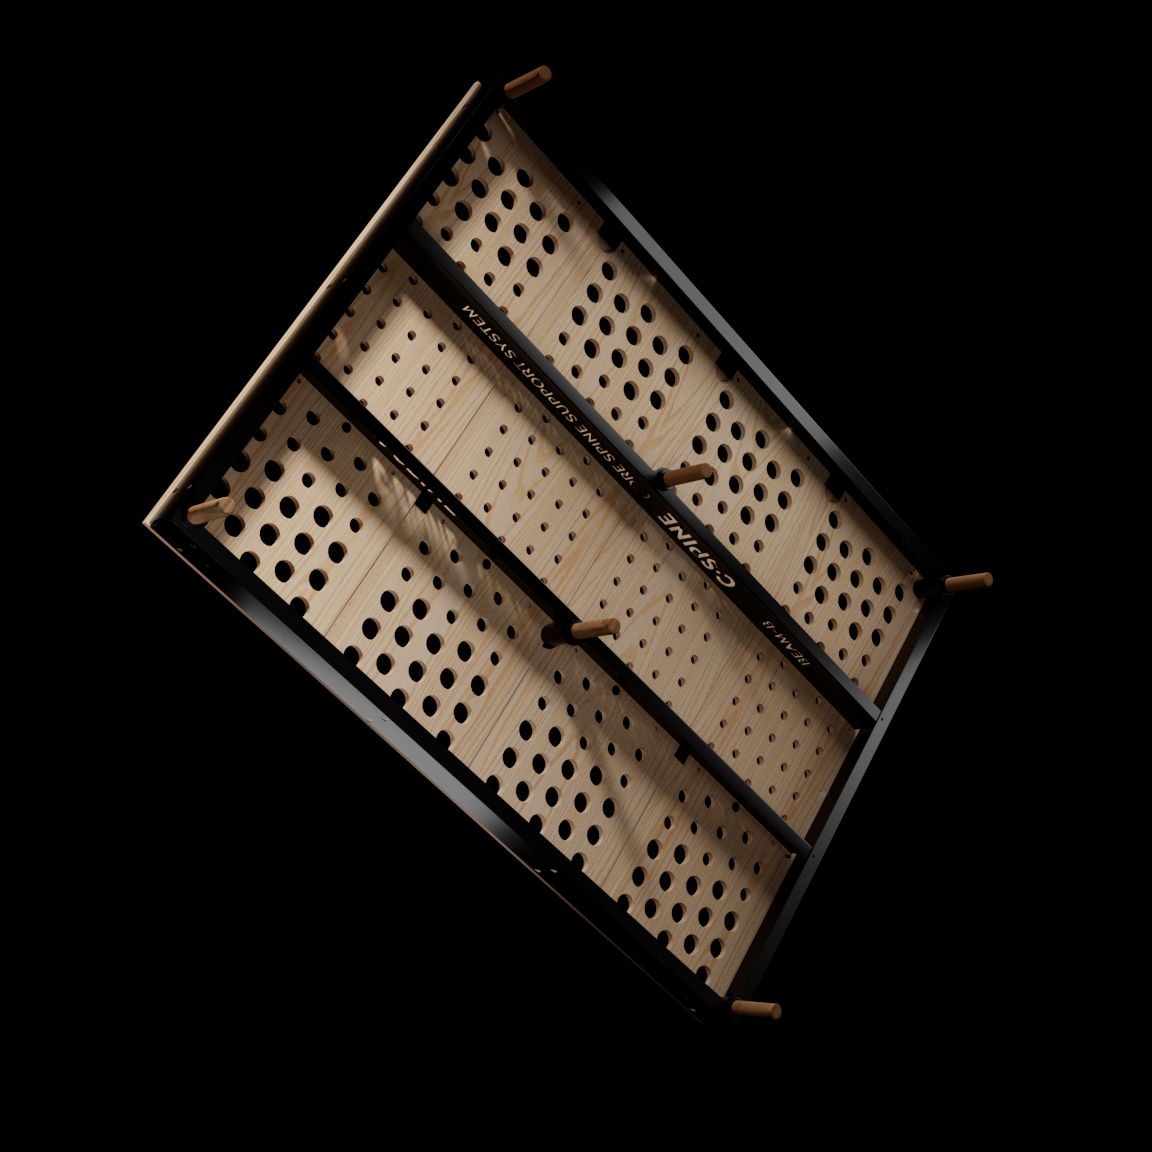
Card 5 of 7 · video
Indestruct Steel Core Support System
50kg of steel support inside each bed, with dual Core Spine (C Spine) Support Beams... one under each sleeper.
Learn More
Card 6 of 7
Uniform Distribution Air Support Panels
Superior to slats
Learn More

Card 7 of 7
Sleepingduck.com
Learn More
View in Meta Ad Library →
Koala Eco
Home and Garden
3 cards
What the cards do: One offer repeated on a video card and two image cards.
Card 1 of 3 · video
20% Off + Free Gifts
Made with Australian Essential Oils
Shop Now
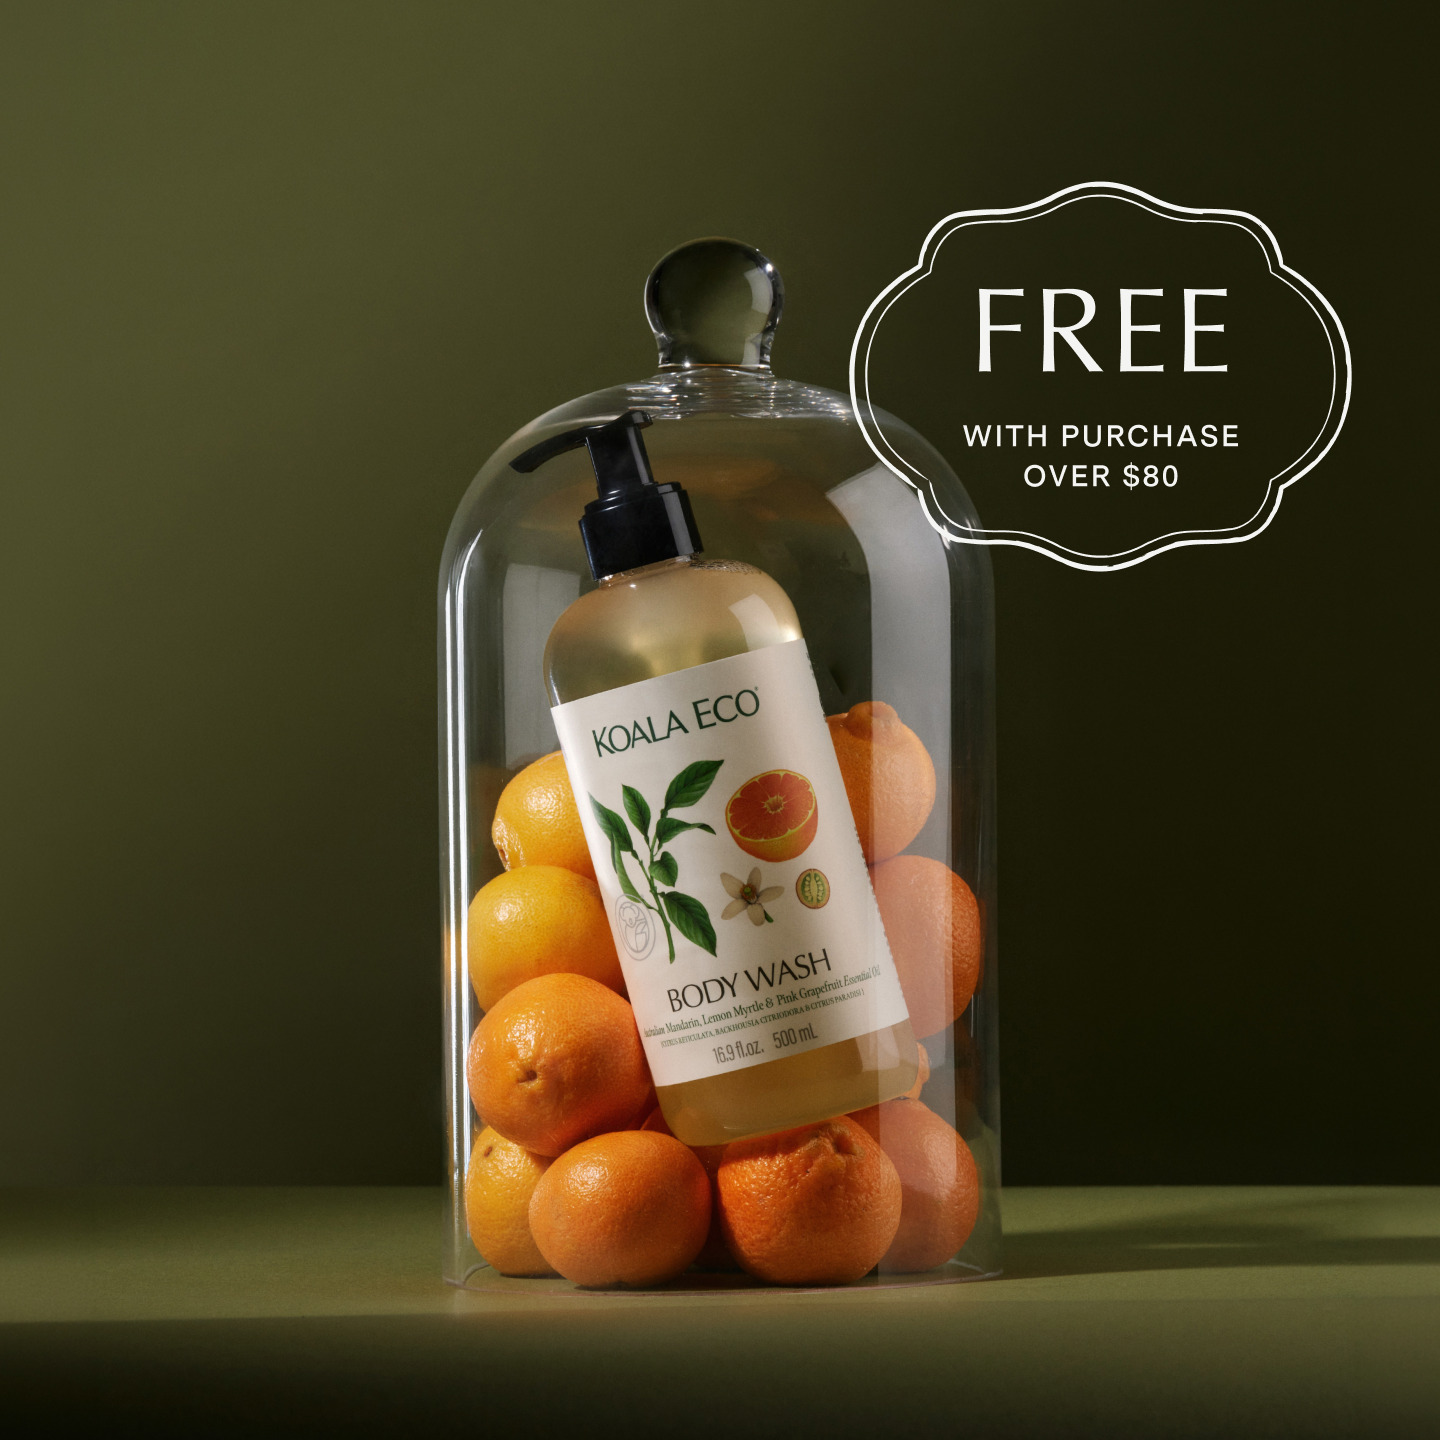
Card 2 of 3
20% Off + Free Gifts
Made with Australian Essential Oils
Shop Now

Card 3 of 3
20% Off + Free Gifts
Made with Australian Essential Oils
Shop Now
View in Meta Ad Library →
Fitbod
App and Software
2 cards
What the cards do: Two video cards under one repeated headline.
Card 1 of 2 · video
Train Smarter with Fitbod
Install Now
Card 2 of 2 · video
Train Smarter with Fitbod
Install Now
View in Meta Ad Library →
With Beside
App and Software
8 cards
What the cards do: Eight cards, one headline: the images carry the story.

Card 1 of 8
Meet your AI team
Learn More

Card 2 of 8
Meet your AI team
Learn More

Card 3 of 8
Meet your AI team
Learn More
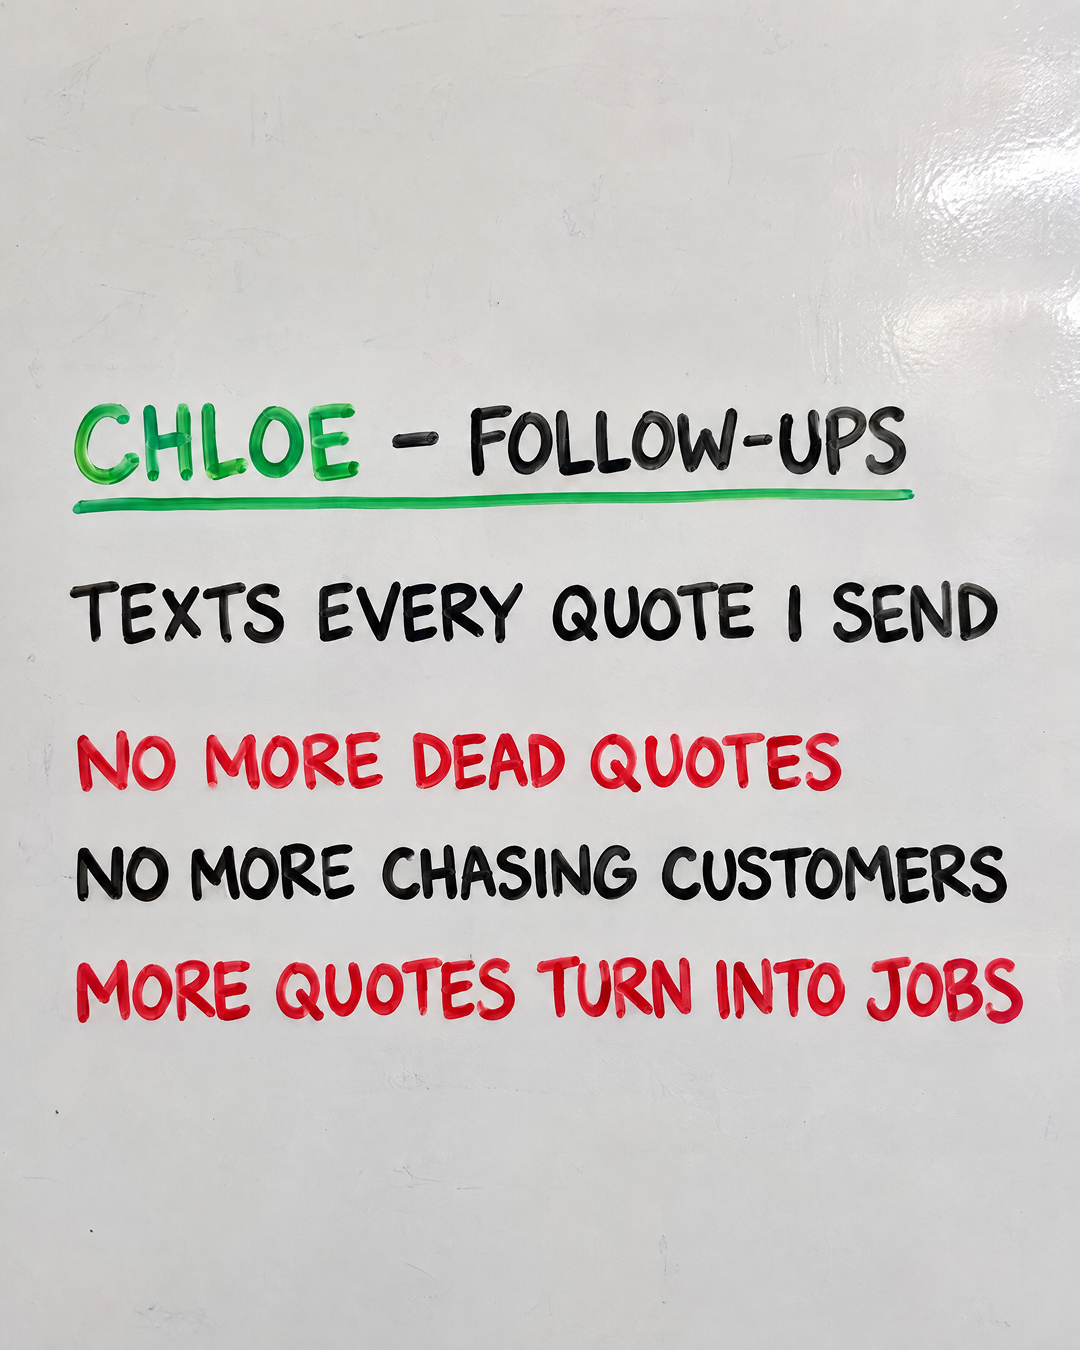
Card 4 of 8
Meet your AI team
Learn More
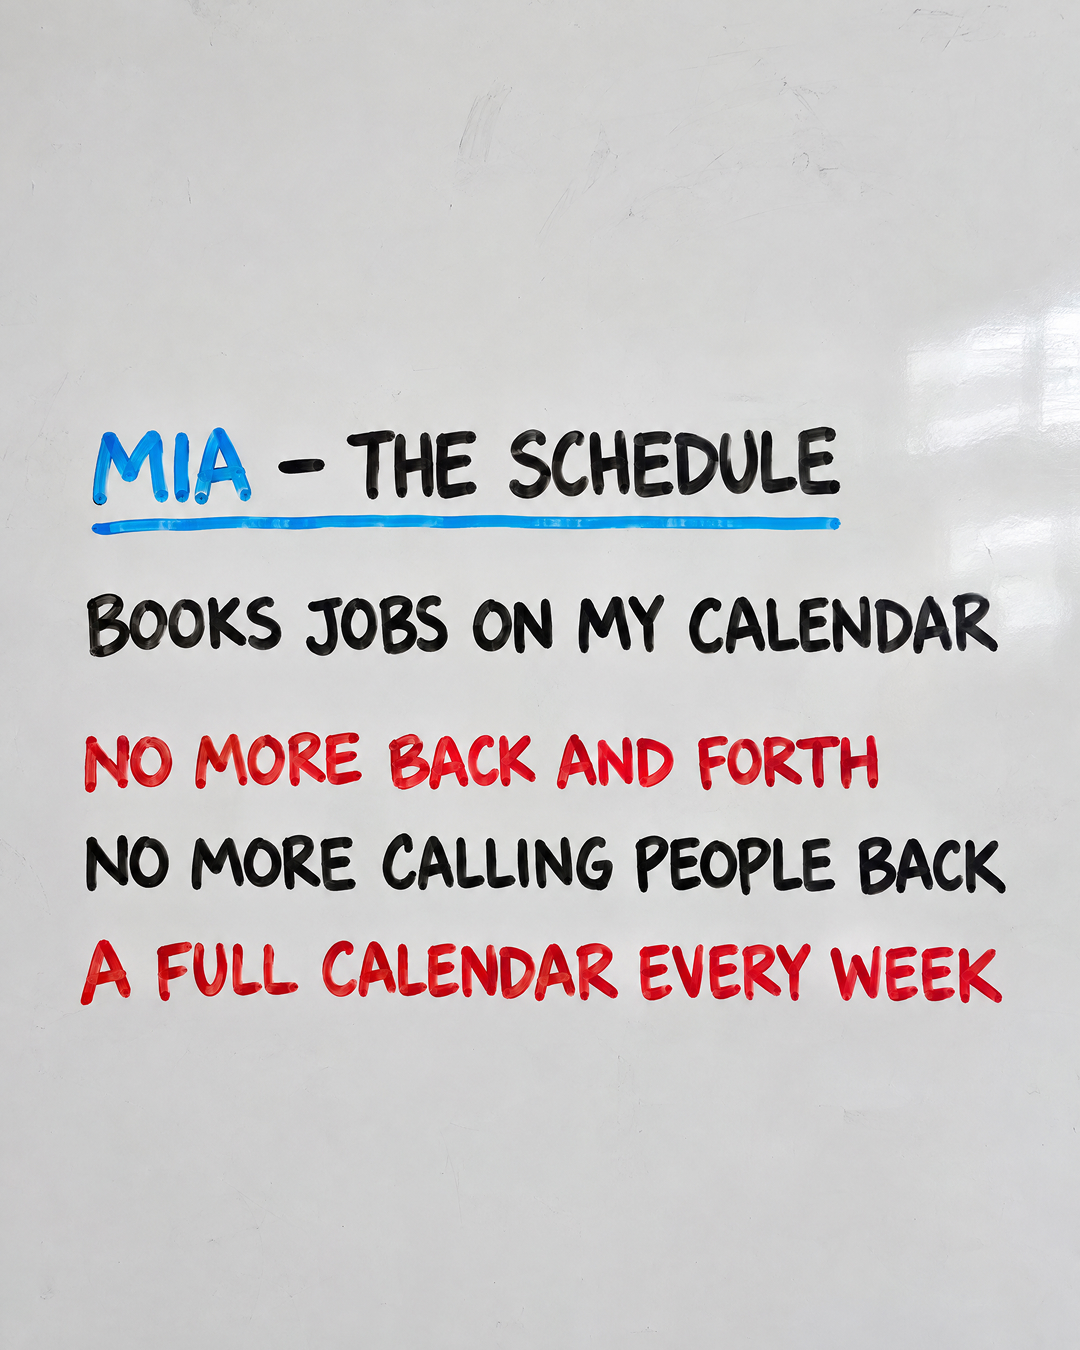
Card 5 of 8
Meet your AI team
Learn More
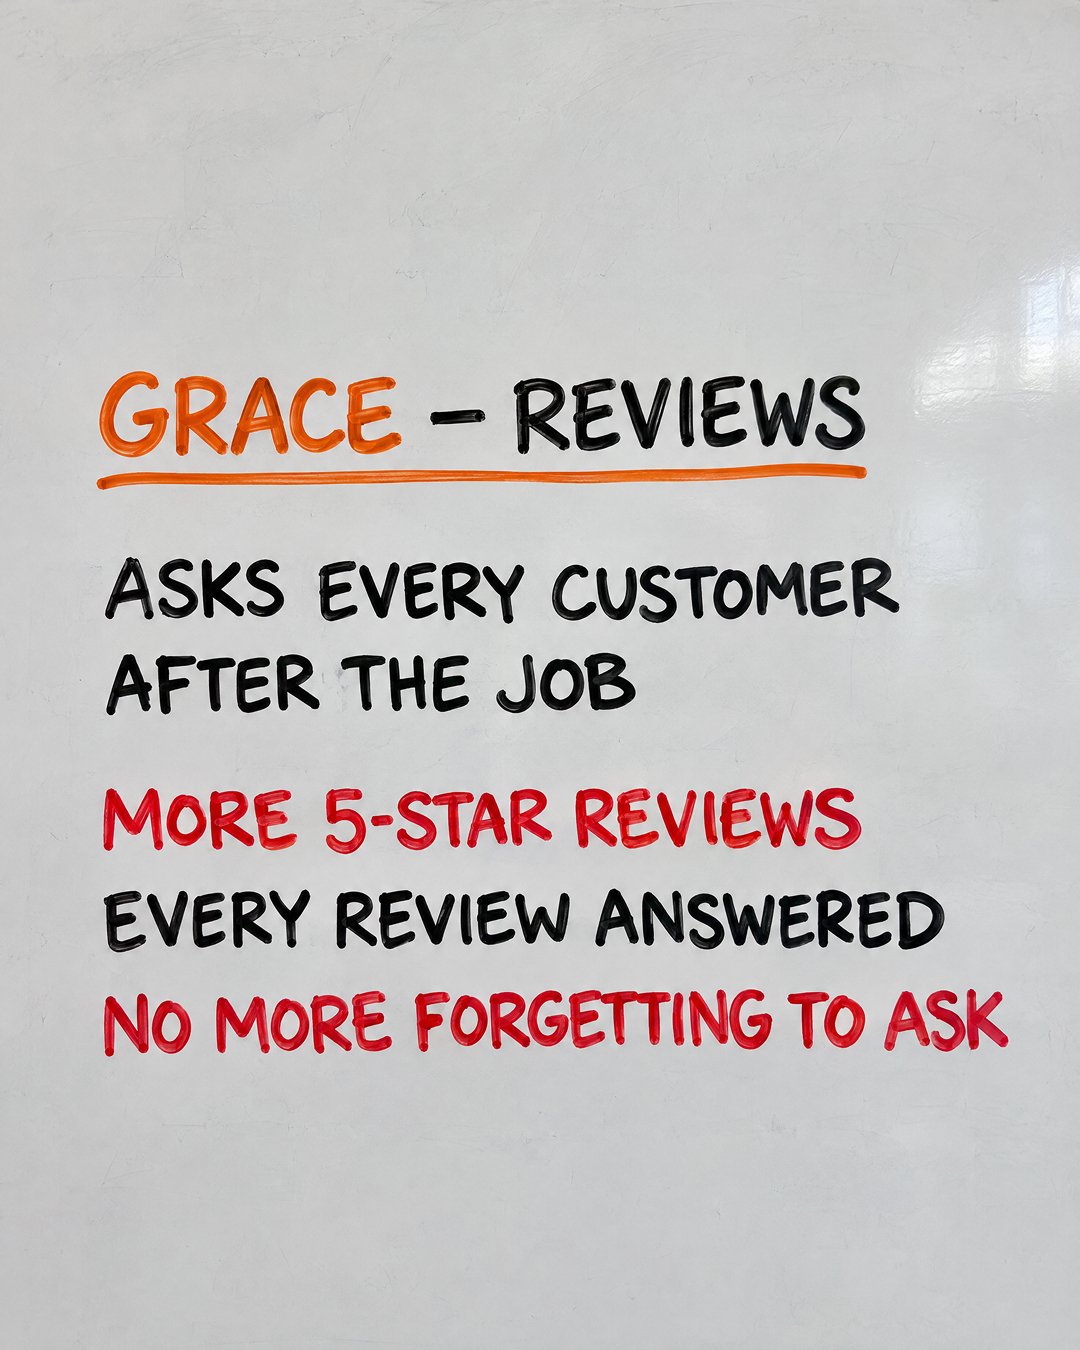
Card 6 of 8
Meet your AI team
Learn More
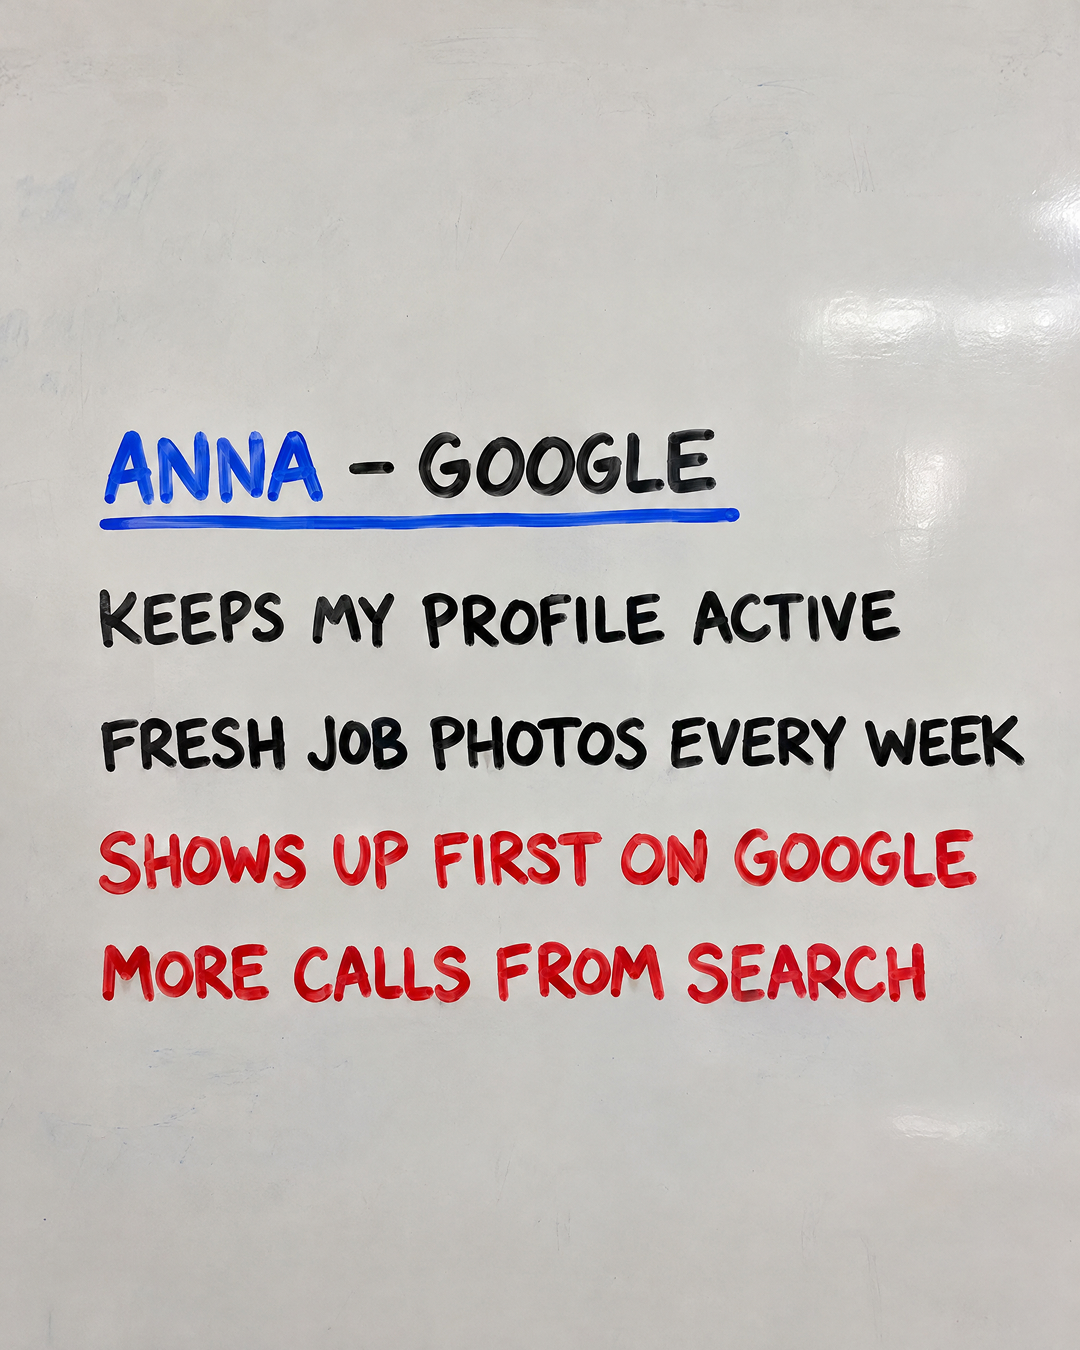
Card 7 of 8
Meet your AI team
Learn More

Card 8 of 8
Meet your AI team
Learn More
View in Meta Ad Library →
Dr Frank's Weight Loss Clinic Australia
Medical
5 cards
What the cards do: Steps: a reassurance line per card, from first question to ongoing support.

Card 1 of 5
Too Many Options? Start Here
Explore Dr Frank’s personalised approach to weight management and take the online assessment.
Apply Now

Card 2 of 5
A Plan Built Around Your Lifestyle
Discover personalised guidance that considers individual goals, routines and preferences.
Apply Now

Card 3 of 5
Explore Your Options With Dr Frank
Learn about available weight management options and the support offered through Dr Frank’s Australia.
Apply Now

Card 4 of 5
Support Beyond Your First Step
Explore a structured program with personalised guidance and ongoing support where appropriate.
Apply Now

Card 5 of 5
Personalised Support, Available Online
Learn more about Dr Frank’s online program and start with a convenient online assessment.
Apply Now
View in Meta Ad Library →
Autohaus Plaschka GmbH
Automotive
10 cards
What the cards do: Inventory: ten used cars, model and mileage in each headline.
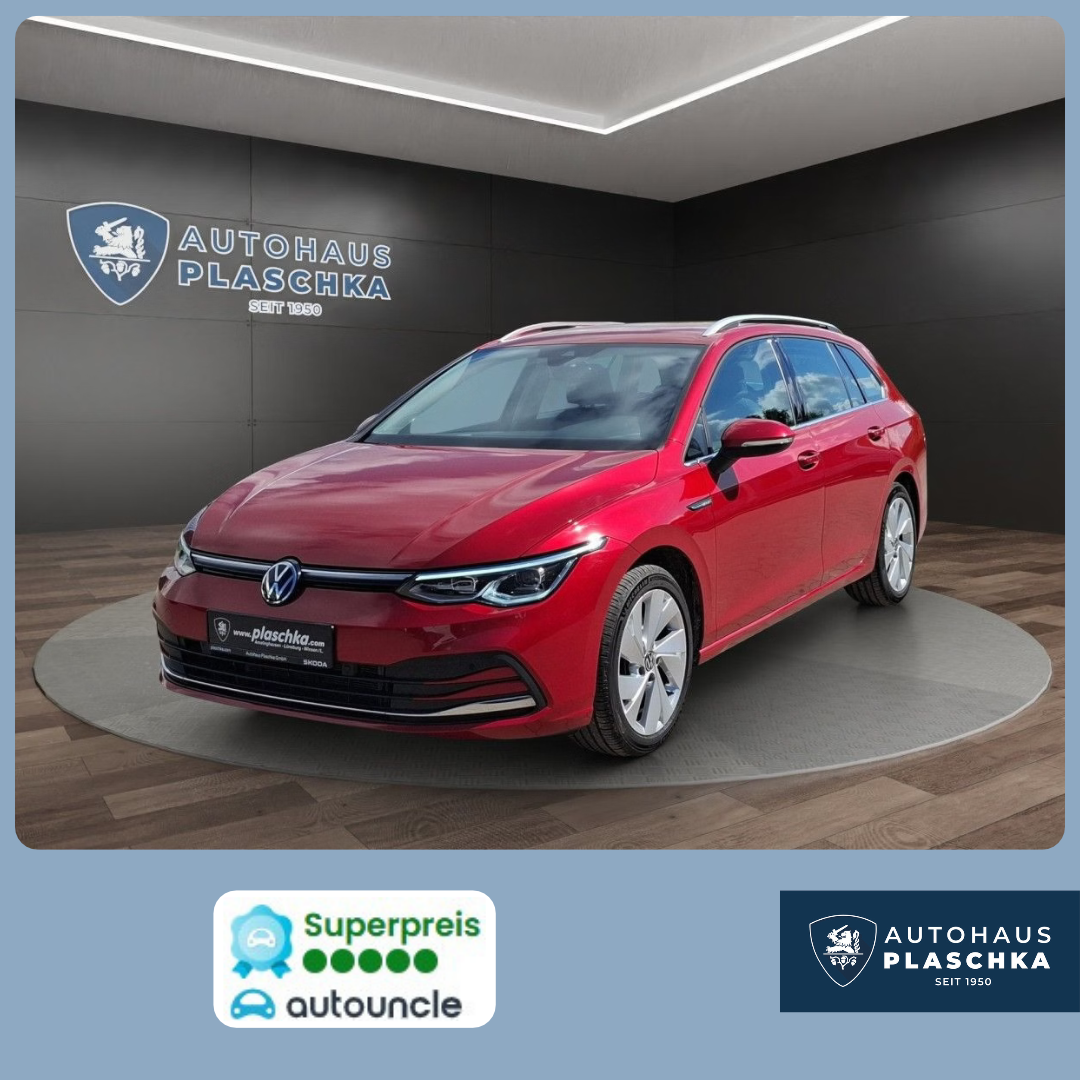
Card 1 of 10
VW Golf VIII Var. 2.0 TSI DSG Style - 47.700 km
See Details
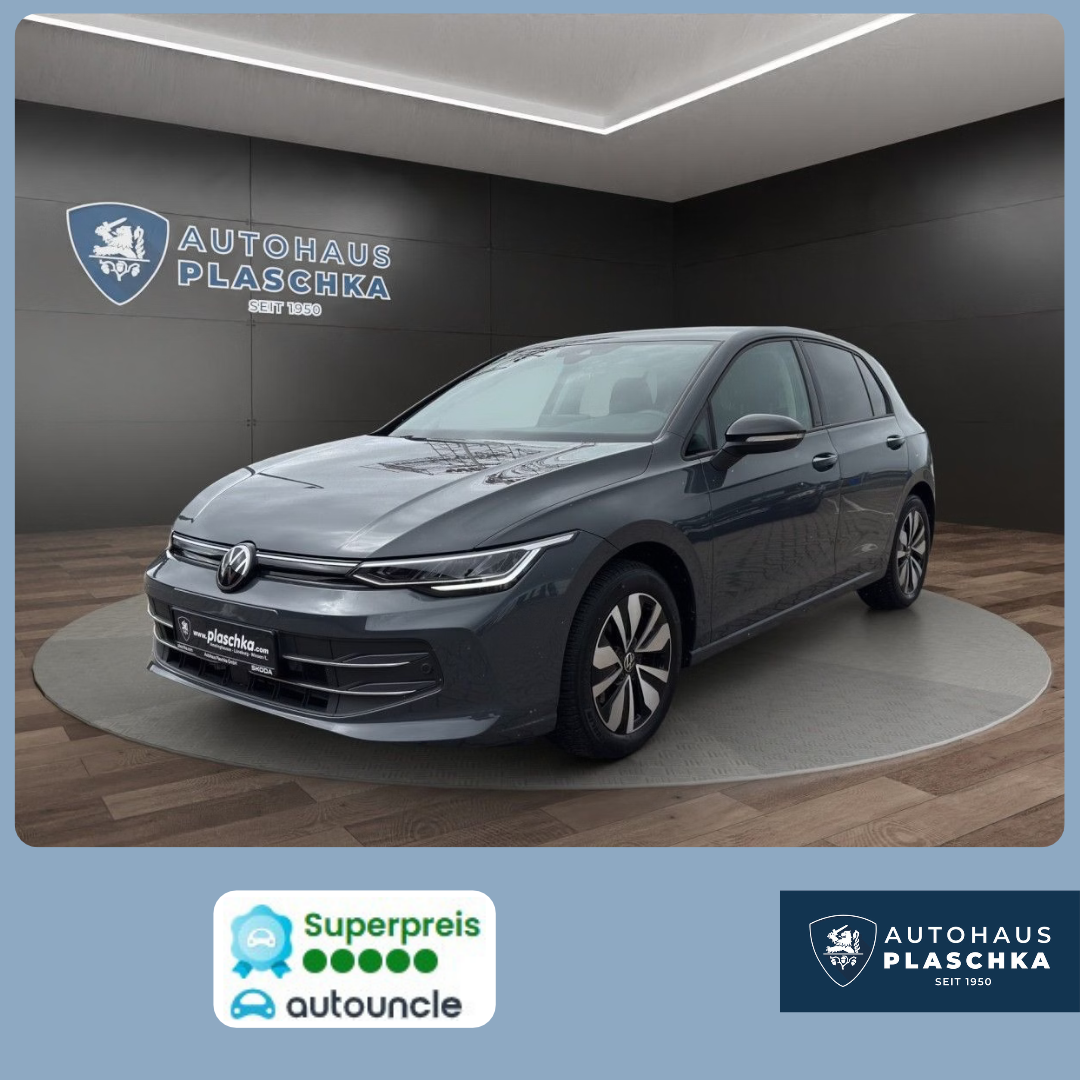
Card 2 of 10
VW Golf VIII Lim. 1.5 TSI Goal - 45.350 km
See Details
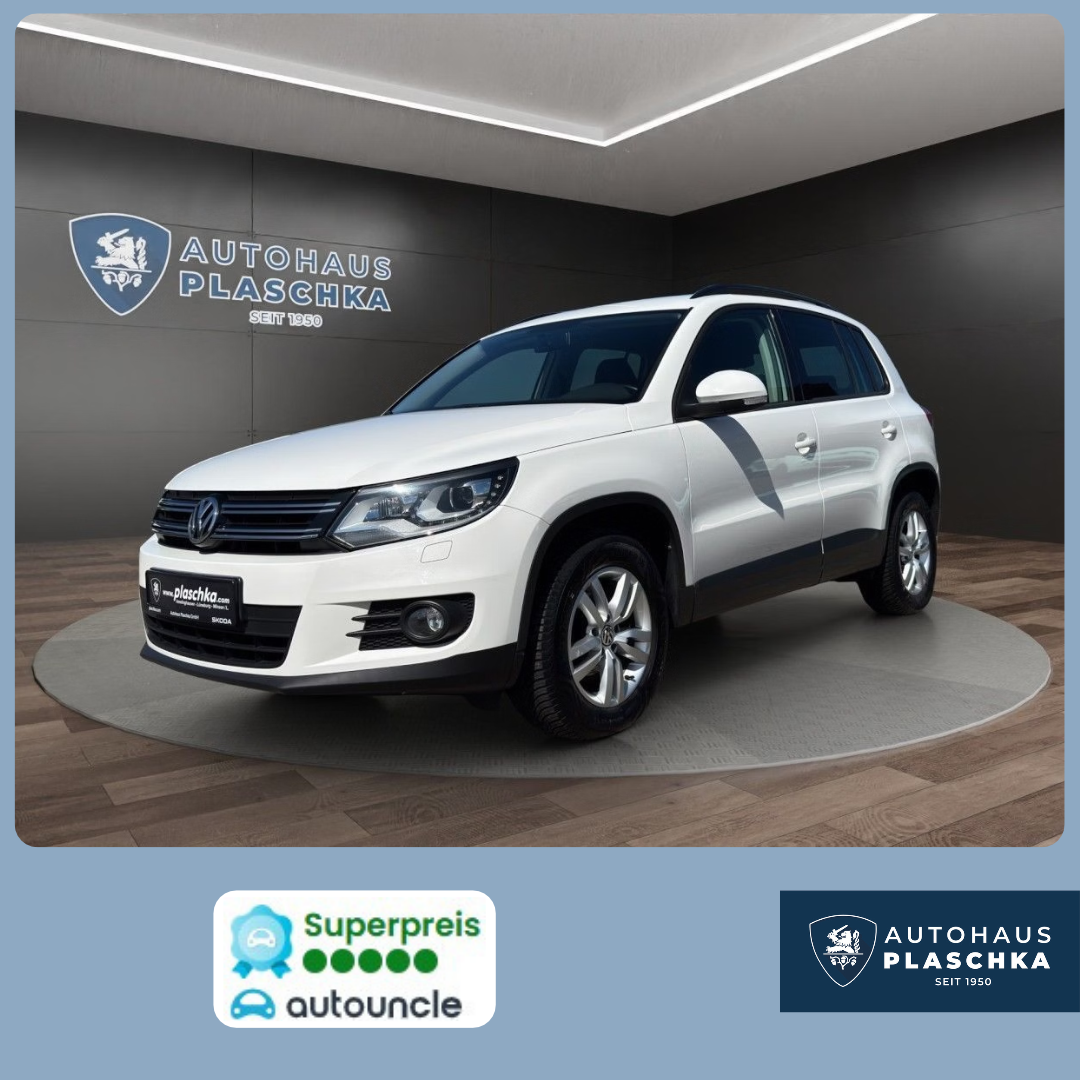
Card 3 of 10
VW Tiguan 2.0 TDI BMT 4Motion- 174.000 km
See Details

Card 4 of 10
SKODA Superb C. 2.0 TDI DSG 4x4 Style - 51.700 km
See Details

Card 5 of 10
SKODA Superb Combi 1.6 TDI Style - 195.600 km
See Details
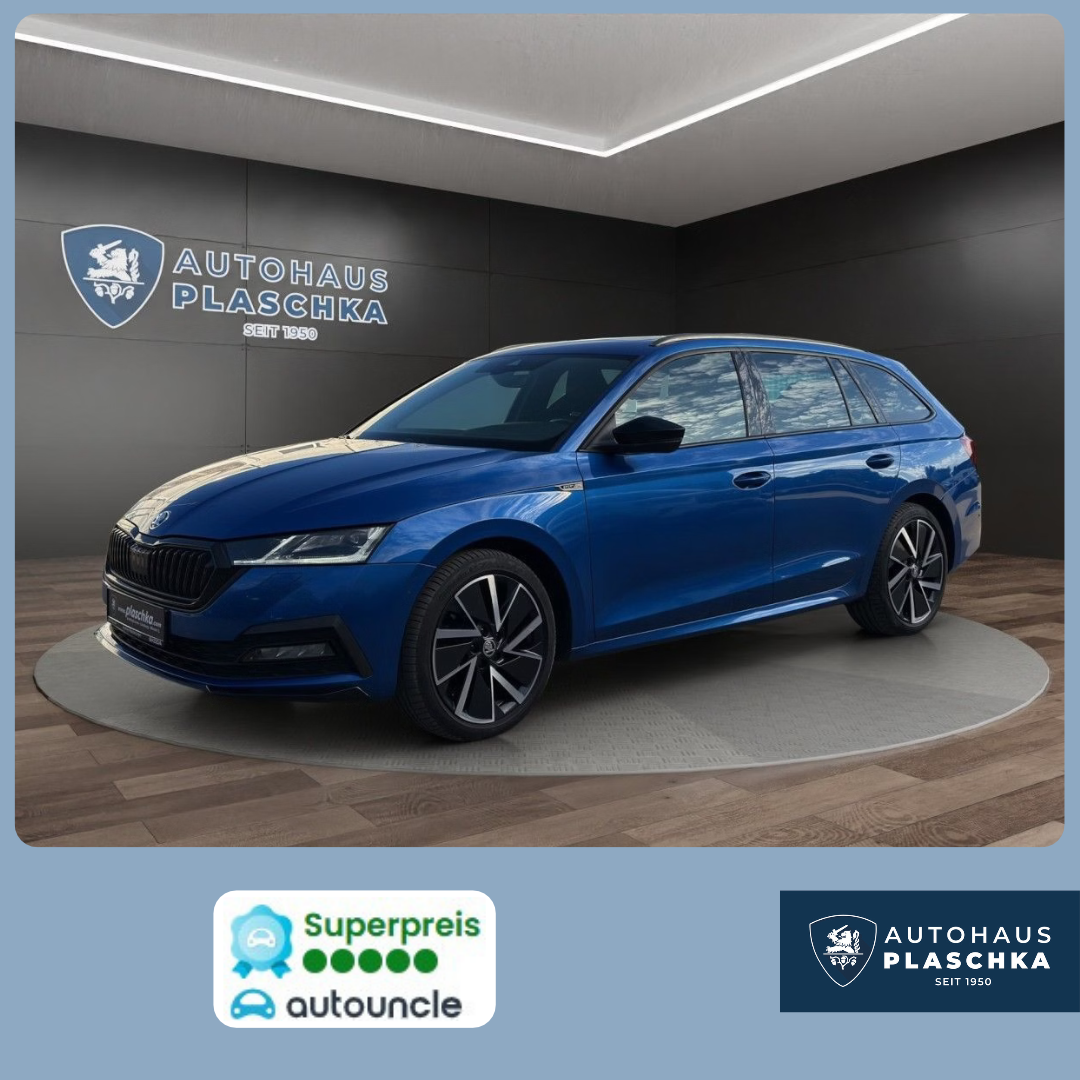
Card 6 of 10
SKODA Octavia C. 2.0 TSI DSG 4x4 Sportline - 99.700 km
See Details

Card 7 of 10
SKODA Kodiaq 2.0 Bi-TDI RS 4x4 - 170.000 km
See Details

Card 8 of 10
SKODA Karoq 2.0 TDI Ambition - 59.059 km
See Details

Card 9 of 10
VW T-Roc 1.5 eTSI DSG Life - 28.600 km
See Details

Card 10 of 10
VW T-Roc 1.5 eTSI DSG Life - 29.100 km
See Details
View in Meta Ad Library →
OMNIYAT
Real Estate
4 cards
What the cards do: Place, service, buildings, scarcity: one selling point per card.
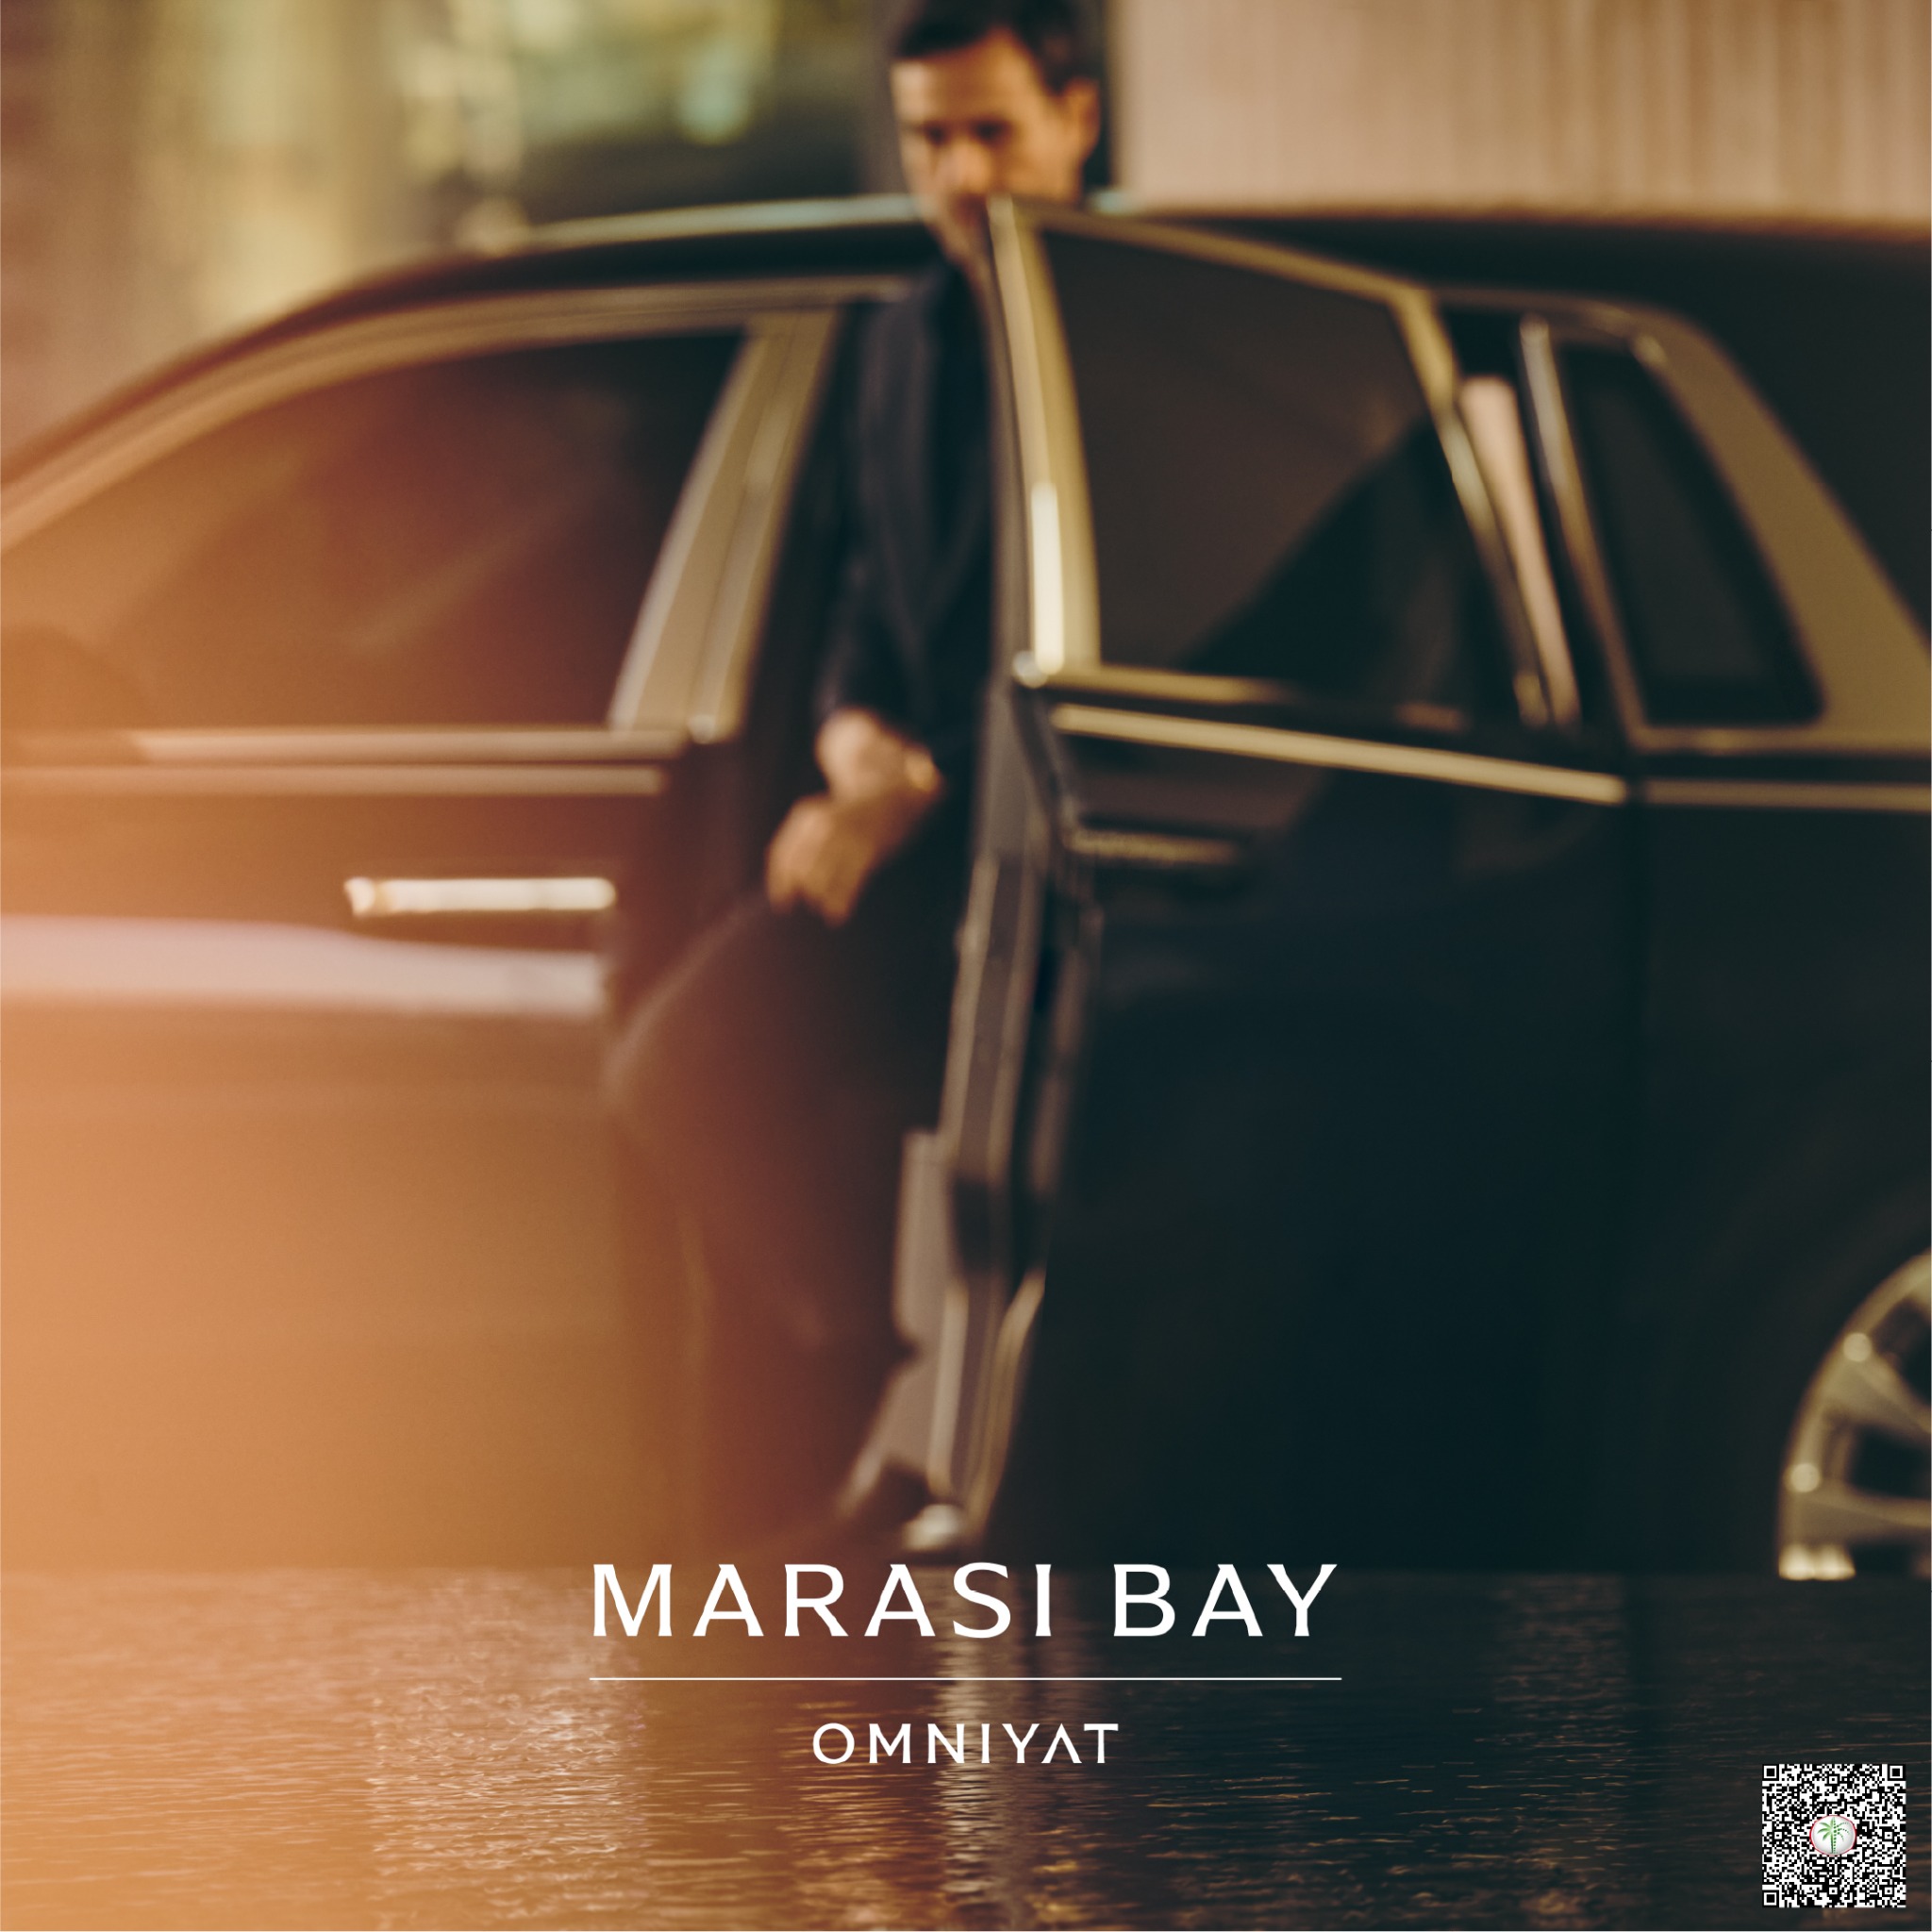
Card 1 of 4
Arrive to Marasi Bay
Learn More

Card 2 of 4
World-Class Hospitality
Learn More

Card 3 of 4
Iconic Masterpieces
Learn More

Card 4 of 4
Limited Waterfront Residences
Learn More
View in Meta Ad Library →
72 Crystals
Jewelry and Watches
10 cards
What the cards do: Catalogue: ten products, a benefit phrase before each product name.
“💰 Elevate Your Prosperity! 💎 Unleash success with our exclusive crystal collection for entrepreneurs. From Money Bracelets to Wealth Pyramids, amplify your business vibes now! ⏰ Limited stock. Seize abundance today! ✨…”

Card 1 of 10
Crystal Path to Success: Money Bracelet 💎
Shop Now

Card 2 of 10
Wealth Blooms: Carnelian Crystal Tree 🌳💰
Shop Now

Card 3 of 10
Manifest Prosperity: Money Abundance Crystal Bracelet 💎💰
Shop Now

Card 4 of 10
Flow to Prosperity: Money Crystal Bracelet 💸
Shop Now

Card 5 of 10
Chakra Bliss: Crystal Coasters 🌈
Shop Now

Card 6 of 10
Pyramid of Prosperity: Money Wealth Crystal 💎💰
Shop Now

Card 7 of 10
Luck and Wealth Bloom: Peridot Money Tree 🌳💰
Shop Now

Card 8 of 10
Attract Wealth: Citrine Shree Yantra Pyramid 💎💰
Shop Now

Card 9 of 10
Draw in Prosperity: Green Onyx Money Pyramid 💸
Shop Now

Card 10 of 10
Triple Money Magnet: Attraction Crystal Bracelet 💰
Shop Now
View in Meta Ad Library →
cult
Health and Wellness
9 cards
What the cards do: Sale video first, then categories and a payment-terms card.
Card 1 of 9 · video
Sale is Live
See Details

Card 2 of 9
See Details
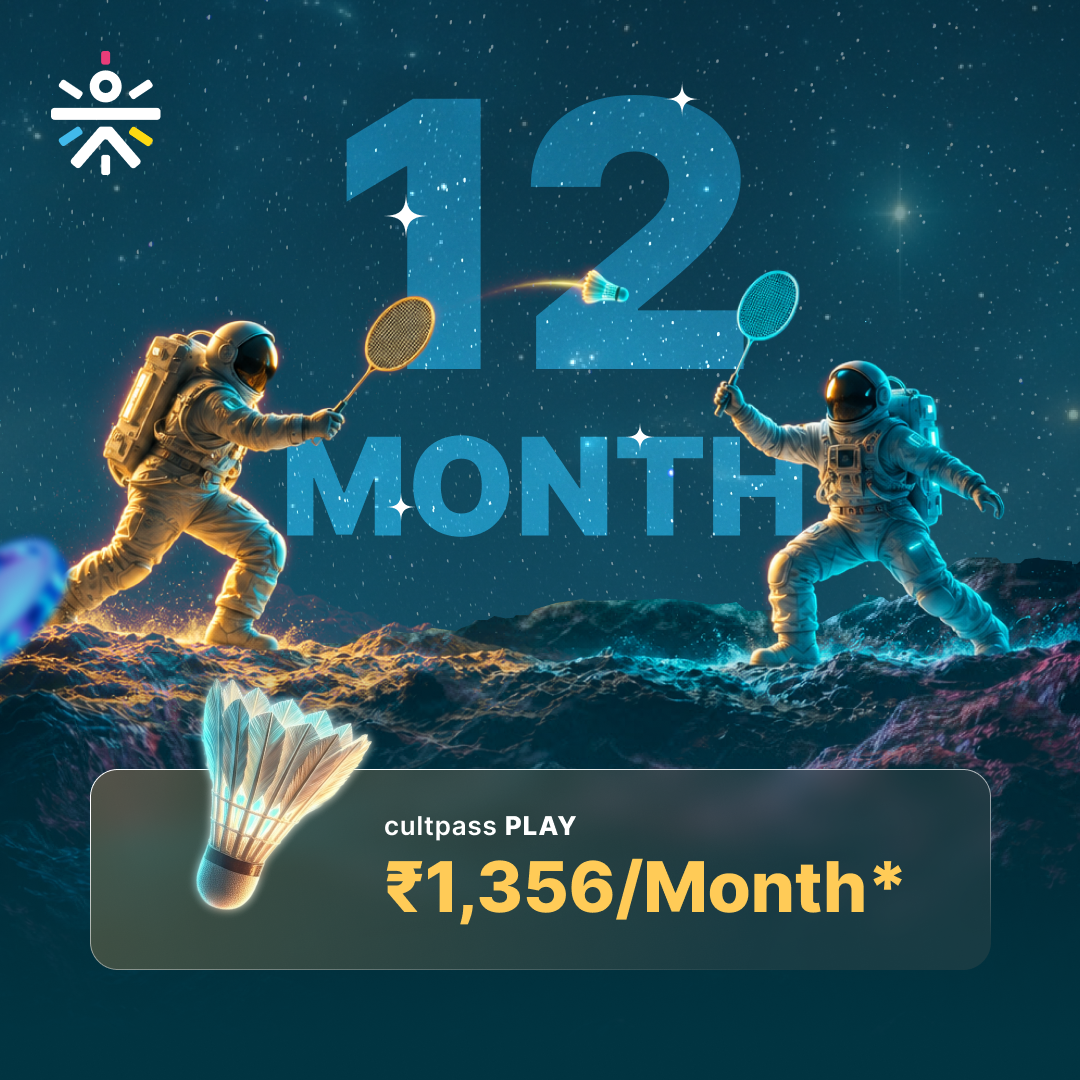
Card 3 of 9
No-Cost EMI Available
See Details

Card 4 of 9
See Details

Card 5 of 9
Dive into Fun
See Details
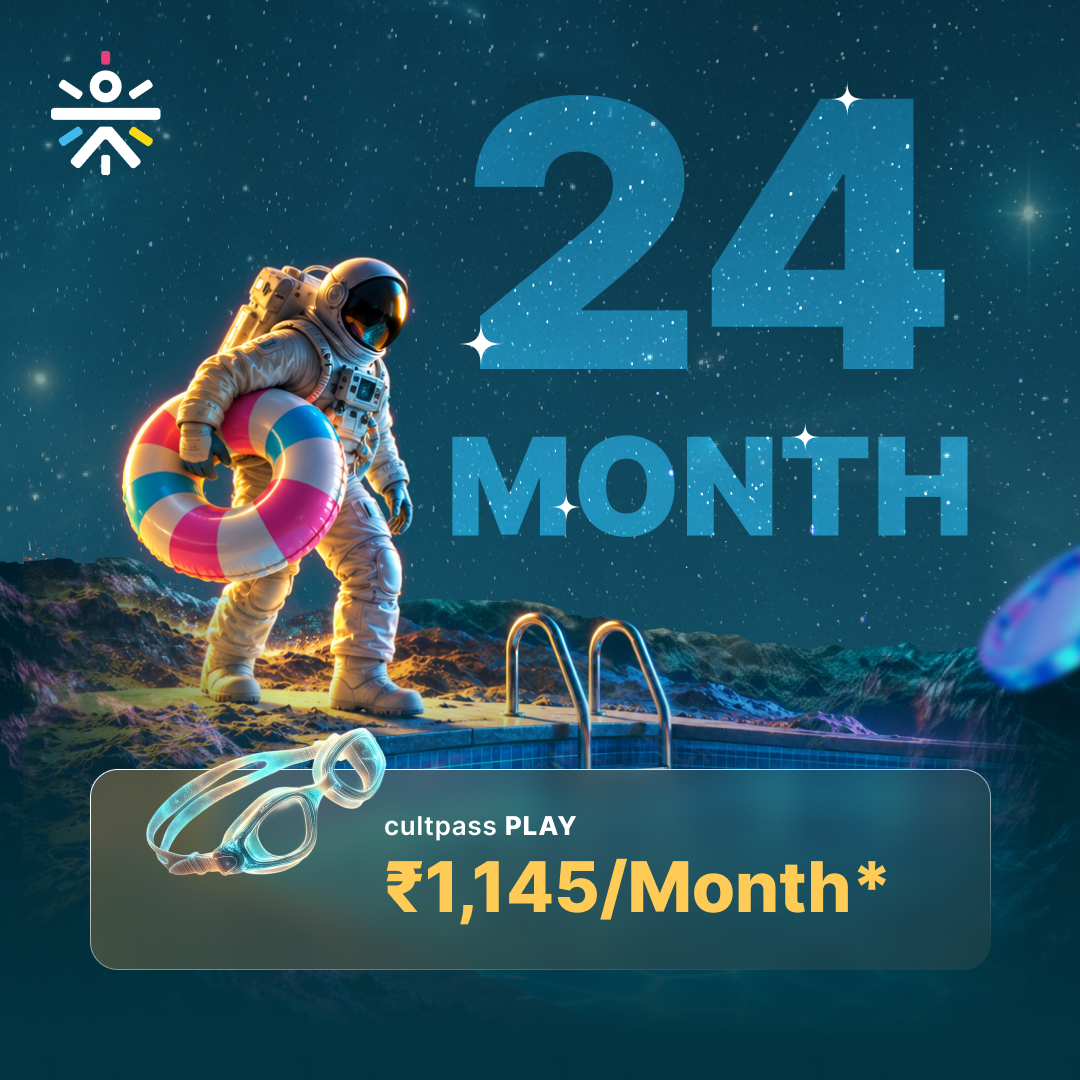
Card 6 of 9
Your game. Your rules
See Details
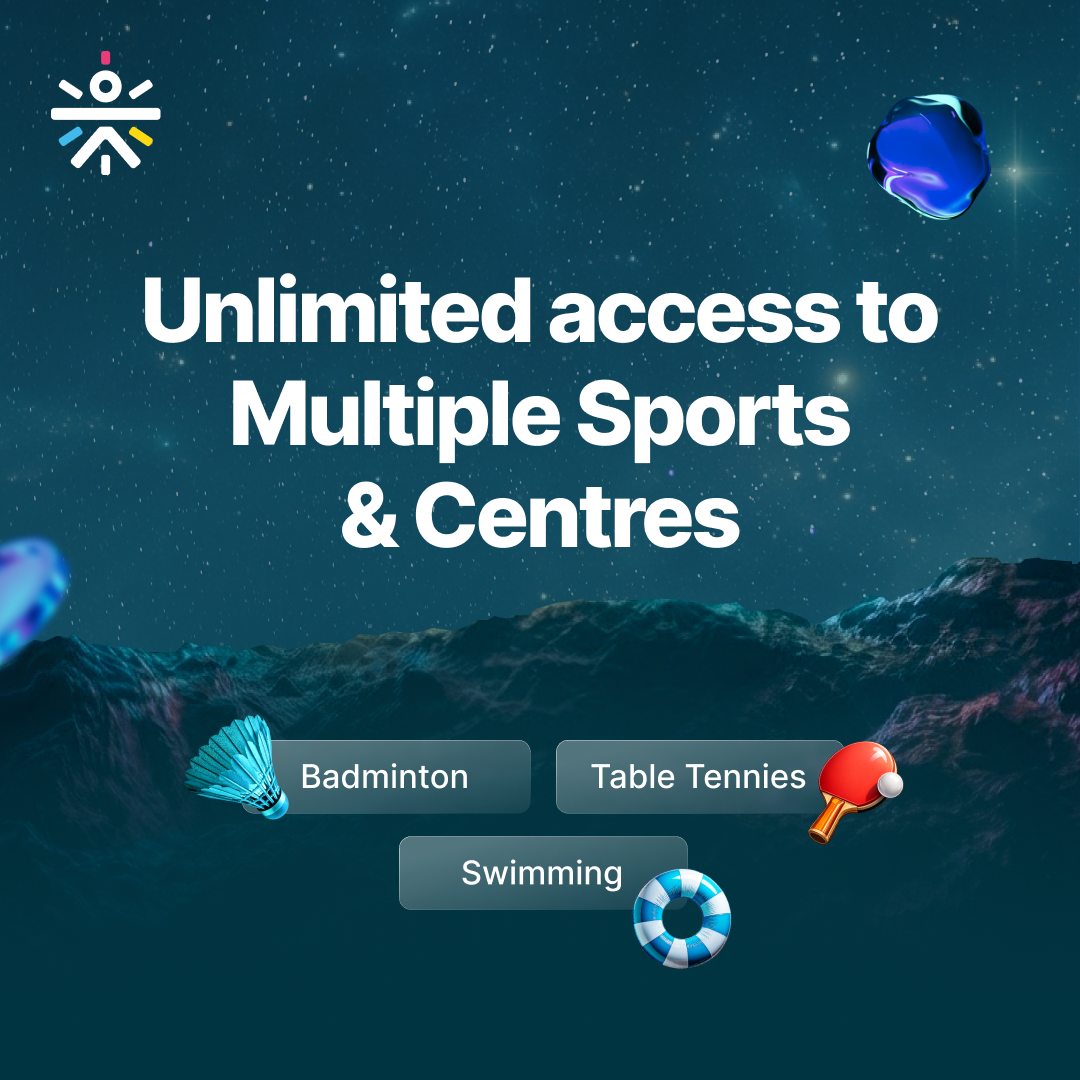
Card 7 of 9
No-Cost EMI Available
See Details

Card 8 of 9
Your game. Your rules
See Details

Card 9 of 9
Don’t miss the best deals
See Details
View in Meta Ad Library →
Source: GoMarble ad library, live Meta carousel ads, pulled November 21, 2026. Ad copy and card text are shown as written by each advertiser.